Finding ideal lens spacings for a scanning photo-exposure design for screen printing, with measurement and simulation.
This is part of a series exploring the design of a novel scanning photo-exposure technique for screen printing and other light-sensitive media (cyanotypes, platinum and palladium prints, photo-chemical etching, etc). This exposure technique scans a light strip across the screen and stencil, using focusing lenses to achieve the excellent exposure characteristics of a room-sized projection lamp in the compact space of a typical light table.
This post examines spacing patterns of lights and their lenses along the strip, and how changing the distance between lights impacts the cumulative exposure shape and variation in light levels.
The next step in prototyping a scanning photo-exposure unit is experimenting with different lenses and finding the right spacing for each one. Different lens spacings along a strip change how individual light spots add and accumulate into an exposure, as the strip scans across the screen. The ideal exposure has minimal variation along the strip.
This sub-project explores using a low-cost UV sensor to measure the light shape created by different lens types. The sensor scans across a light spot over two axes, producing thousands of measurements that form a three dimensional light shape. This data is then used to simulate different spacings to find ones that minimize light variation across the scanning strip.
Previous sketches and graphing suggested that combined circles could overlap to create a light strip even enough for photo-exposure. This guesswork assumed light spots with even distributions of light. But LEDs don’t produce light shapes with even distributions, and each lens compounds this light shape differently. The question of whether focused lights could form an even strip remained murky, along with other questions of which lenses are suitable and system cost.
This measurement set-up produced high-quality maps of light shapes, and simulations suggest most lenses can work with the right spacing. (Each lens has its own characteristics around exposure quality, cost, longevity, and weight; options gives exposure unit builders flexibility in different situations.) Some parts of this work are useful for other projects, in building exposure units (with sliding or fixed lights), designing low-cost light measurement equipment, and interpreting light sensor measurements.
Background
In purchasing or building ultraviolet photo-exposure units for screen printing, printers have traditionally picked between two designs.
With a projector-style exposure, one focused light source is positioned some distance from the photo-stencil and screen; while these cast crisp, excellent shadows, they take up so much space! This is often whole rooms for the largest of screens. The lamps are not easy to manage, as they have long warm-up and cool-down times. And the space around the screen is not ideal for humans while the light is on — UV light can cause eye damage, and a powerful, focused one is especially dangerous. In many settings (educational or community print studios), this danger is hard to safely contain, and there aren’t any affordable resources for room-sized lockouts.


With an array-style exposure, many unfocused light sources are placed close to the stencil. While the light is safely contained in a shallow box, this compaction creates issues with exposure quality. Each light source casts its own shadow across the photo-stencil, creating a stepped gradient between full light and full dark; when enough light to expose the emulsion cuts behind the stencil, details shrink or disappear entirely.


As previously explored, a scanning technique that sweeps lights across the screen can collimate light in a compact space, pairing the excellent shadows of a projector-style unit with the compact size and safety of an array-style unit.

The Problem With Lens Spacing
In building a scanning photo-exposure unit, the lens spacing is a crucial design parameter. The light spots need to align so the sloped edges of the intensity shape overlap to create even-ish light levels across the light strip. Too close, and these edges overlap and re-accentuate the already high spots of an adjacent light; too far apart, and the intensity valleys between two light spots gape open.
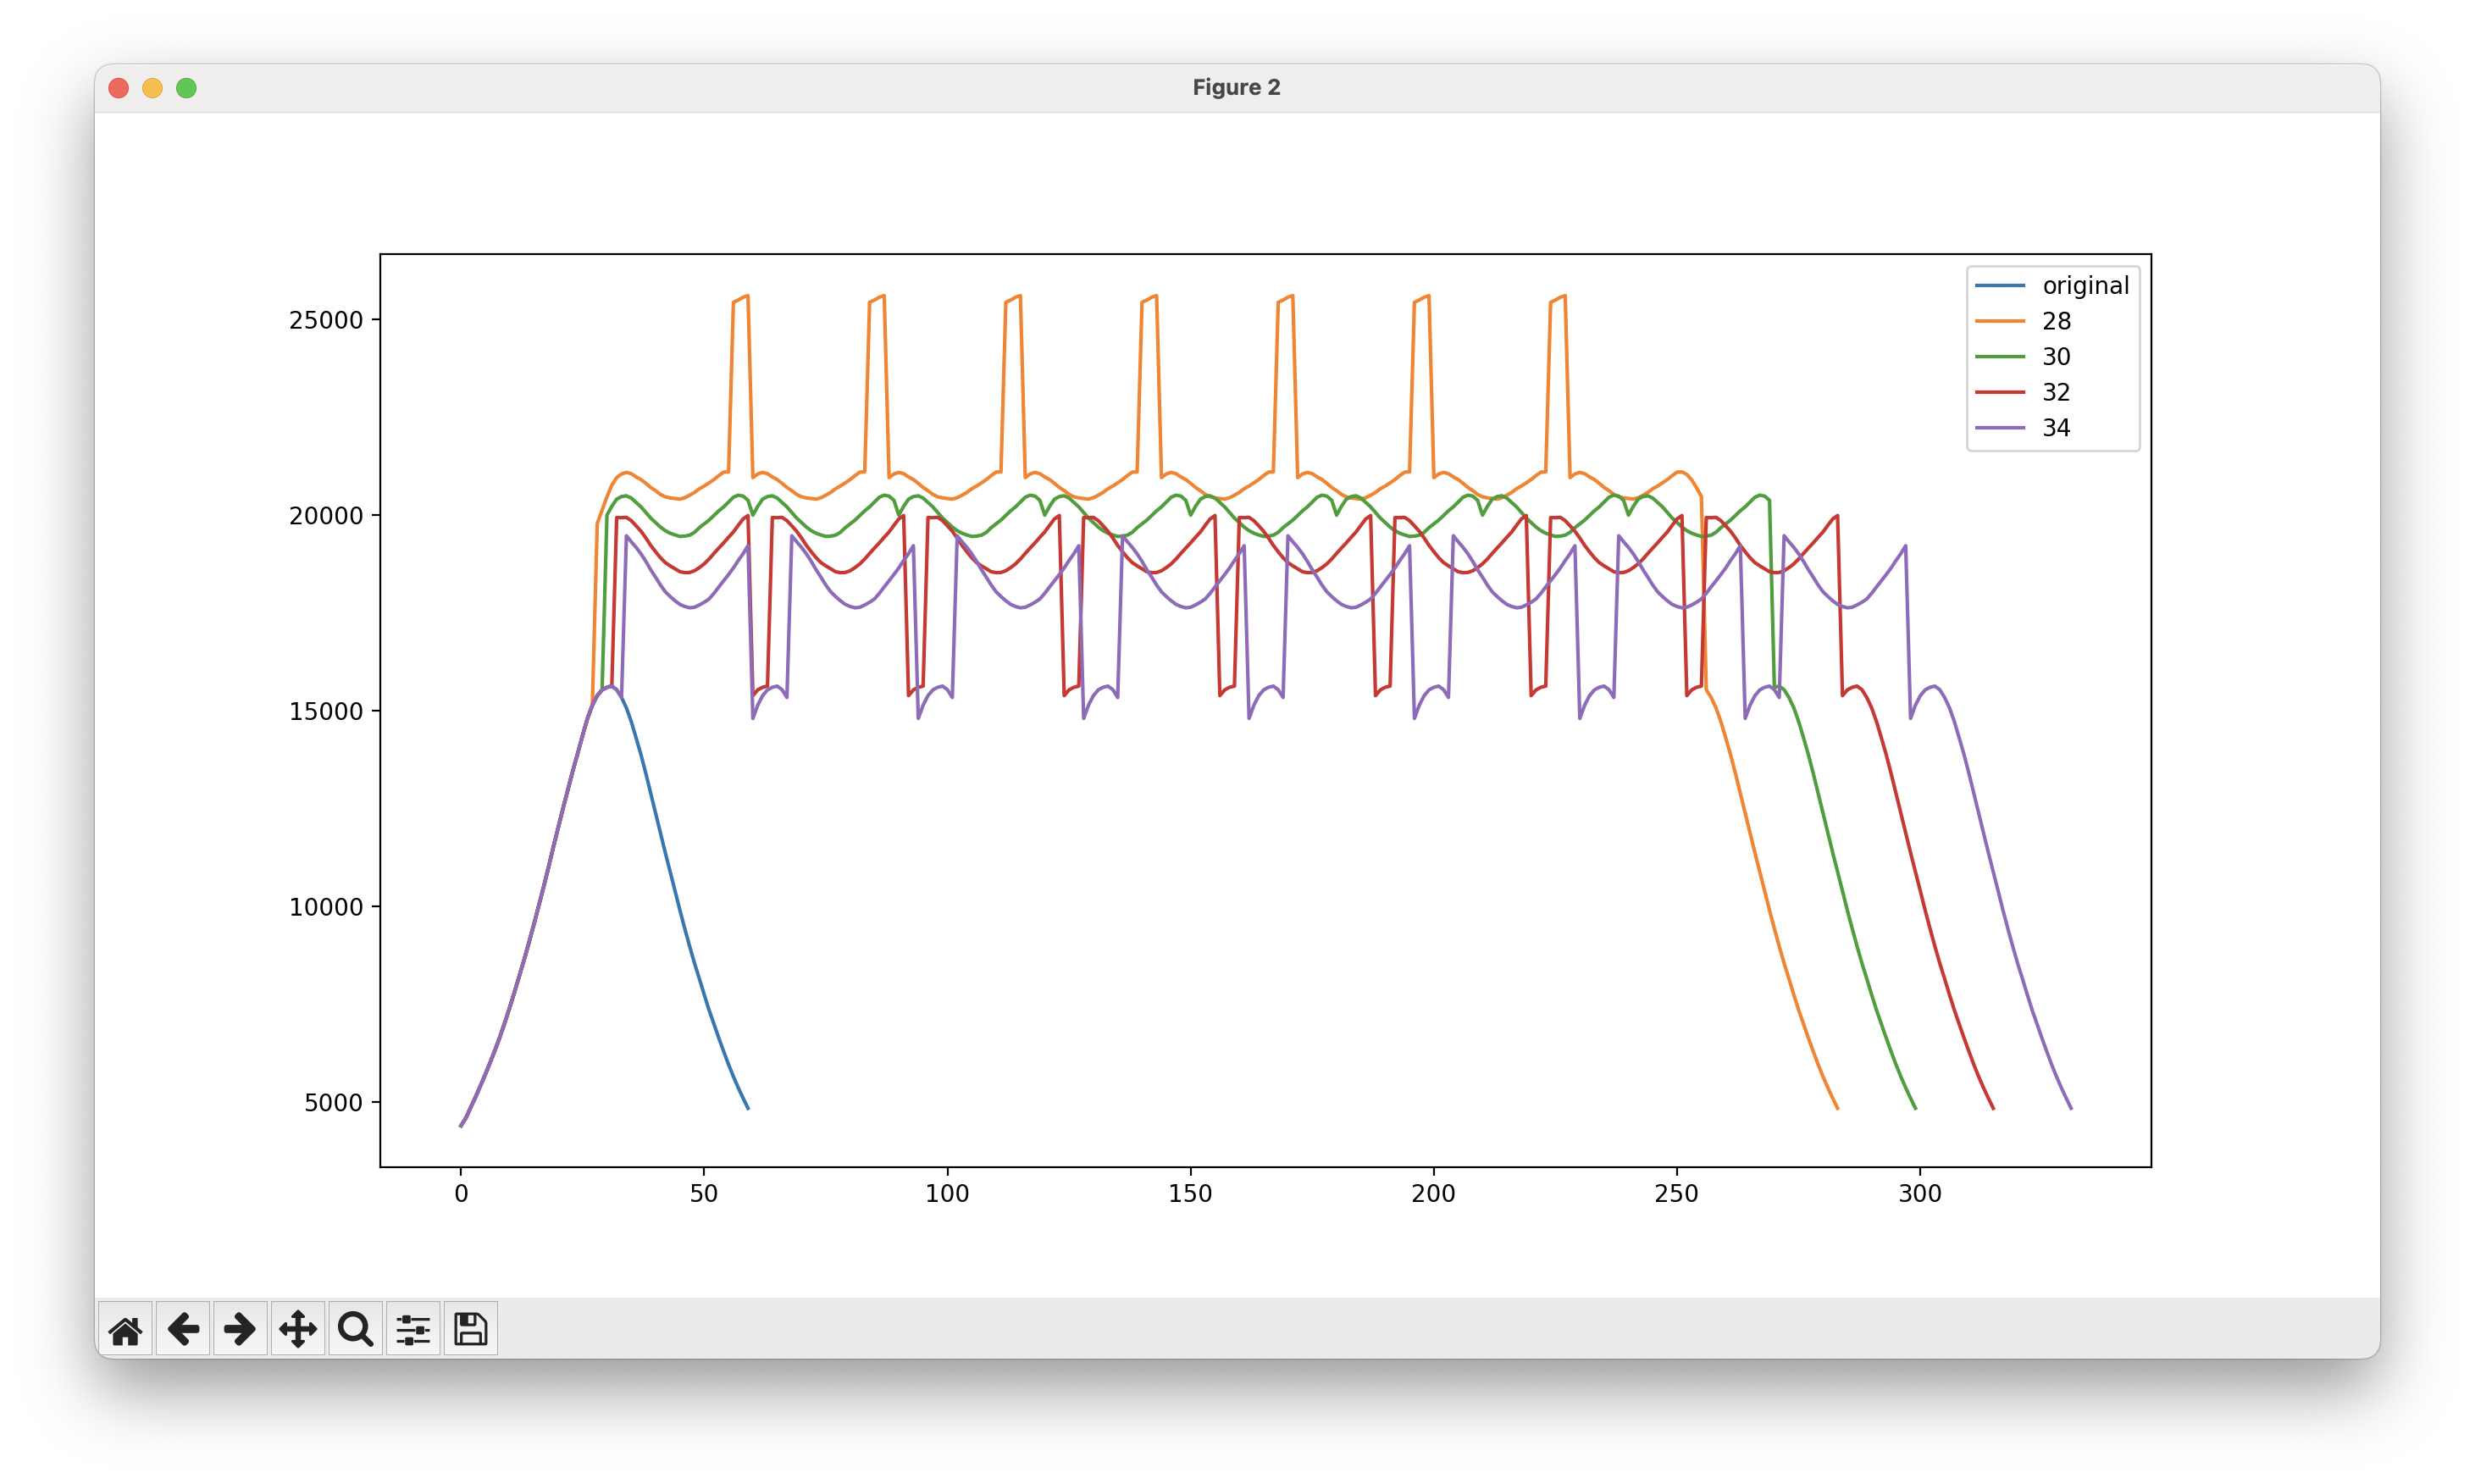 In this graph, a series of simulated spacings are compared for a measured light shape. The orange 28mm plot is too close, with a spike over the light centers; the purple 34mm plot is too far, with a steep valley in between each light. The green 30mm plot is about right, with the ends of each adjacent light tapering in the right spots to create minimal variation.
Having even light levels across the strip is important. A successful design has a wide exposure separation between baked and unbaked emulsion. When a design has a wide range of light levels, this separation becomes too narrow. An exposure is timed to the lowest intensity level across the screen; in the highest-intensity areas, the emulsion behind the mask can bake too much. Excess light is thrown away, wasting resources. The exposure timing becomes overly sensitive. These high spots degrade the screen faster, as overcooked emulsion is hard to remove, and can lurk in the screen. An uneven lighting design can also transfer the stencil unevenly; high and low-intensity areas are unlikely to have the same angular distribution of light, resulting in different projection characteristics.


Each lens shapes the same light differently. The lens spacing is not easy to guess, and it’s hard to tell if a lens will even work well. The sideways integration of a light spot is non-intuitive: some details that show up while examining a light spot, like an extra-wide ring of light or a hint of the LED’s die-shape, may be insignificant in a scanning exposure. The difficulty of guessing turned out be correct: one lens with an even spot test and a well-collimated beam turned out to have the lowest spacing performance.
An earlier idea for locating lens spacing was through repeated exposure experiments, starting from reasonable spacing guesses. This route might have been slow and cumbersome; the experiments need to find a scanning speed for the exposure, with the scanning speed changing somewhat with spacing adjustments.
The Measurement Set-up
The equipment and software built for this experiment has three parts:
- an electro-mechanical system mounts and moves the light, lens, and sensor, using an aluminum extrusion frame and stepper motors
- an embedded controls program coordinates scanning across the light spot, and reads data from the sensor
- an analysis program computes integrations and lens spacings from the measured results
The electro-mechanical system mounts and moves the light, lens, and sensor along two perpendicular axes, supporting readings in precise locations across two dimensions. The light, a 415nm-centered LED made by Semileds and sold on a heatsink by LEDsupply, is mounted on a boom that spans across the inside of a rectangular frame; the boom is driven by a 3mm-pitch belt drive and stepper motor. The light points down, onto the surface of a table; lenses mount on the boom over the light, using a holder specific to the lens’s diameter and focal length. The frame is supported by adjustable-height stilts over the table. The sensor, a Vishay VEML6070 packaged by Adafruit, sits on the table, and slides back and forth in a track; the sensor is driven by a 1mm-pitch lead screw and stepper motor.
The embedded controls program actuates stepper motors and moves the light and sensor in small steps, taking light intensity readings over a square grid. Most experiments covered a 30-50mm square, at a 1mm pitch; the LED was measured without a lens at a 3mm pitch over the entire 180x180mm measurement area. These readings are sent to a desktop computer over USB, where they are saved in a csv file representing the trio of x/y/intensity values across the experiment.
The analysis program examines the csv file of intensity readings, and produces a few characteristics from these: first, an integrated intensity graph: this integrates the measurements along one axis of the measured spot, to model the effect of a light spot sliding by at an even pace. Second, the total exposure intensity is summed across the entire light spot; this is compared to a measurement of the LED with no lens, showing how much of the light made it through the lens. Finally, the data objects are made available for interactive analysis of lens spacings; after inspecting the 2d plots and making some spacing guesses, several functions are available for plotting and locating the best spacing. A little visual analysis is done in gnuplot, and the measurements are fed into pandas, where the dataframe and series objects are used to process and plot this data. (This took minimal effort; once the data was structured and oriented correctly in a dataframe, scanning integration was output by one DataFrame.sum() call; Series.plot() produced the 2D integration graphs, and summing this series again produced the total radiometric output. The spacing comparisons were made with an Series.add() call that filled in the non-existent spaces with zeroes.)
Results!
Results from this measurement and simulation project show that a well-chosen spacing can create an even exposure for most lenses tested. The spacing’s impact on the cumulative light levels across the strip is surprisingly sensitive, with swings in variation found with spacing changes as small as 1 or 2mm. In some cases, these small changes made the difference between a successful and unsuccessful design.
This is the setup, measurement, and simulation process for one lens: a diffused-surface aspheric condenser lens made by Thor Labs. After the lens is mounted and aligned, the measurement routine runs and generates intensity readings across a square grid. For this lens, readings are taken at 1mm steps, across a 50x50mm space. (This totals 2500 readings; at just under one second per reading, plus time for movement, measuring this light shape takes about 45 minutes total.)
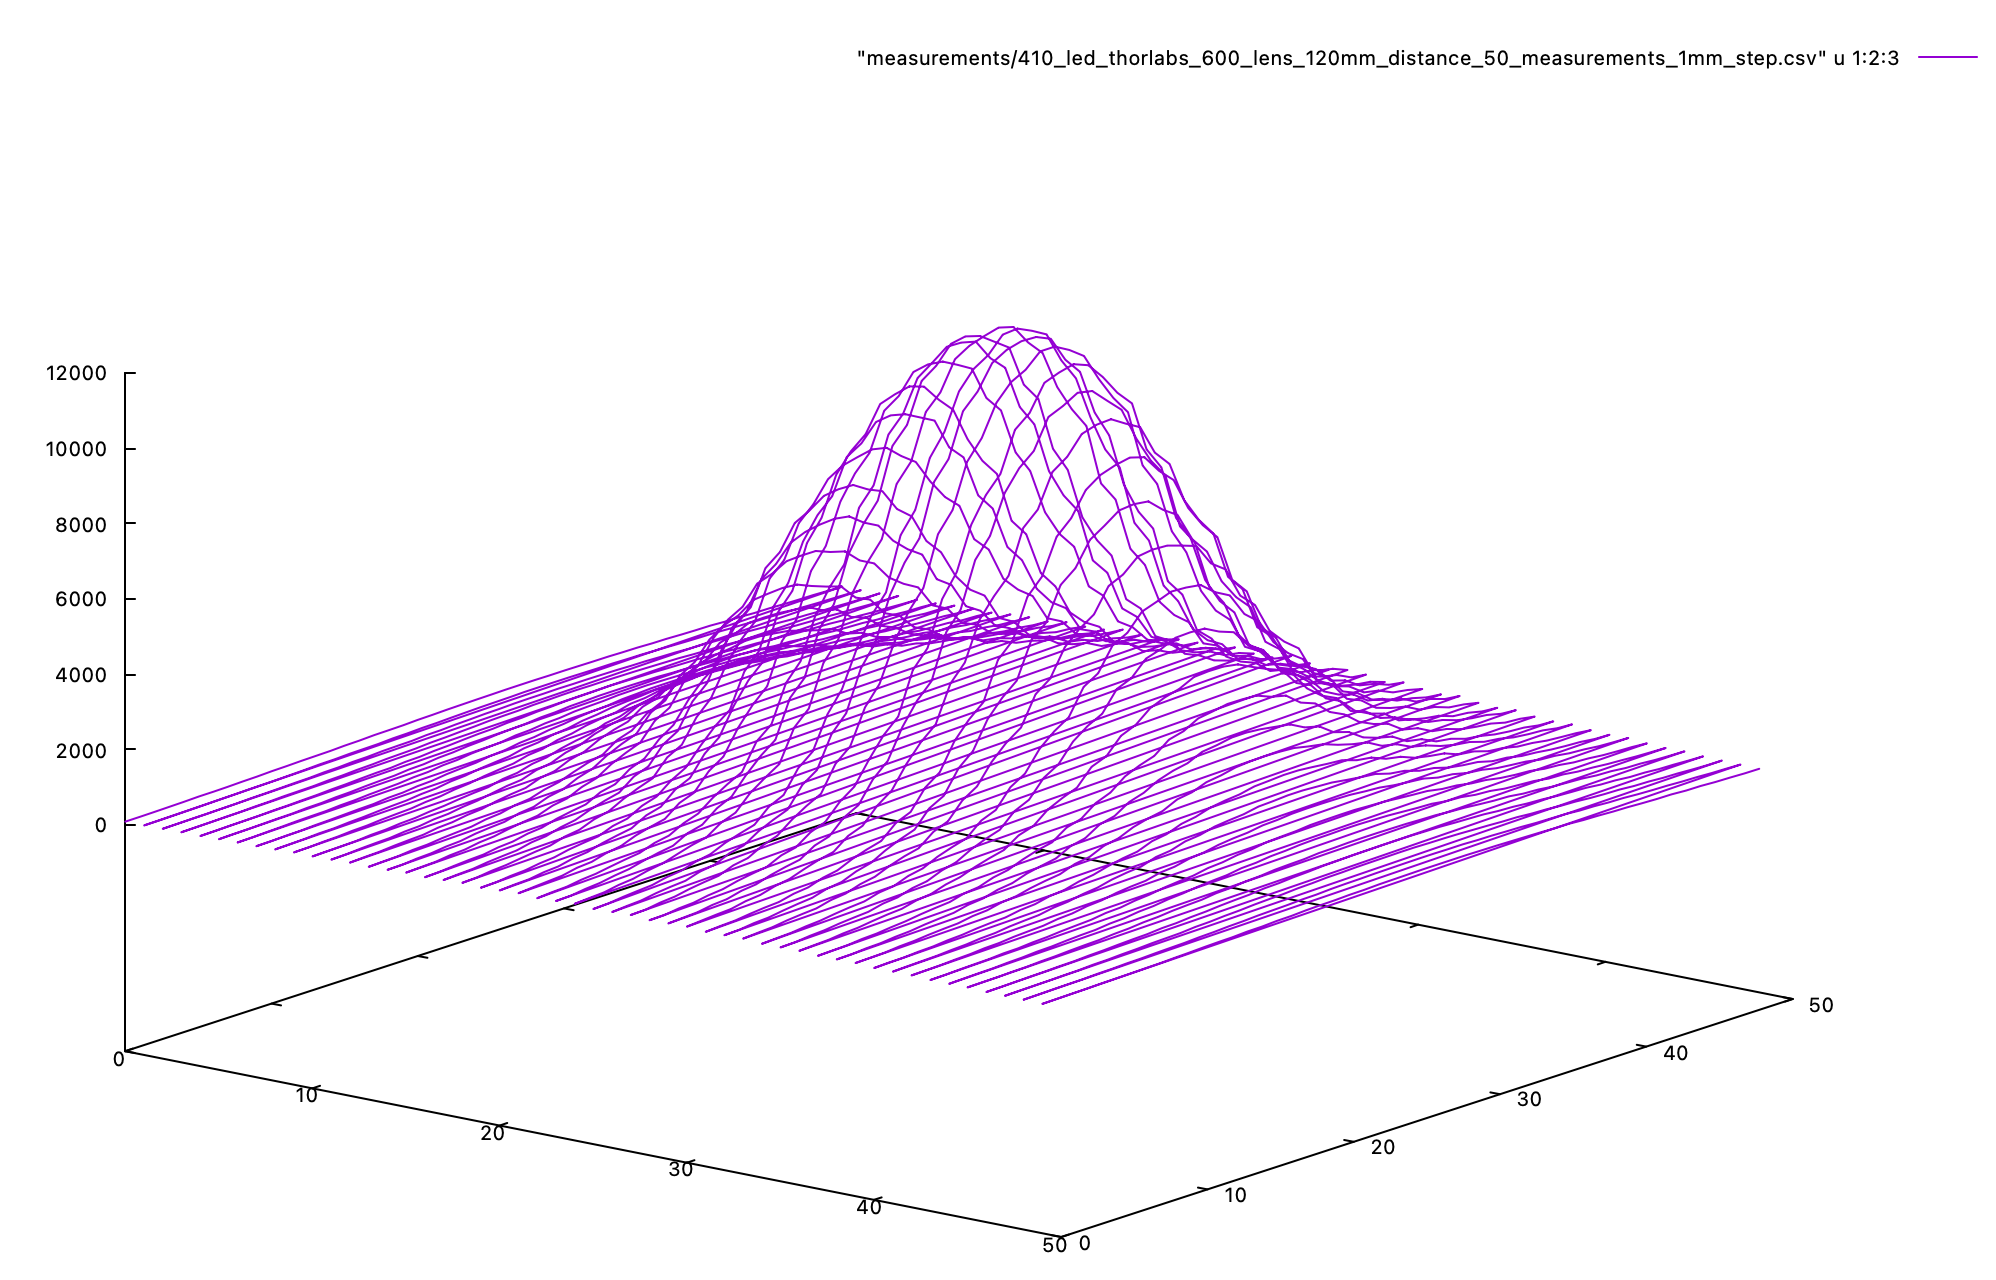
The light shape data is first visualized as a 3d graph in gnuplot. This is a separate step from later analysis, and helps show whether the experiment was set-up well. Misshapen spots reveal issues with lens alignment; cut-off spots show that the experiment area is too small, or offset.
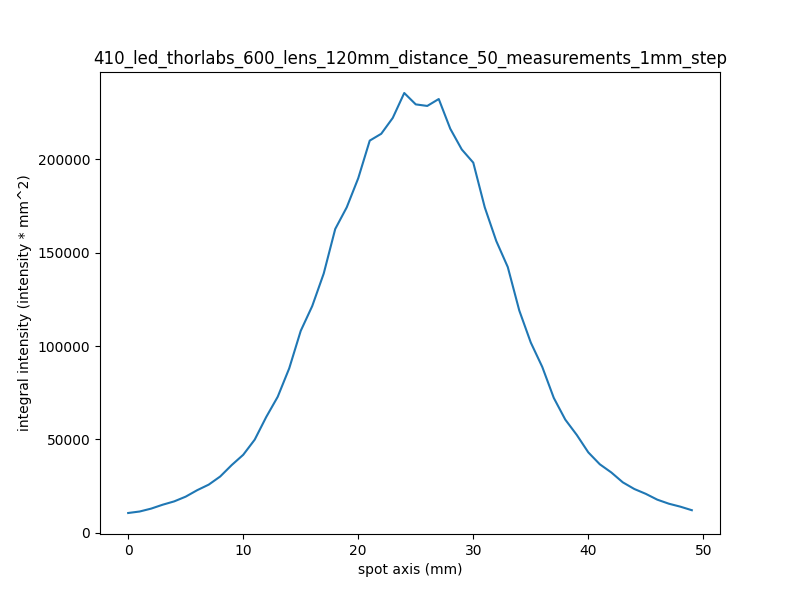
After a successful measurement is complete, an analysis routine examines the measurements. It sums the intensity values along the boom’s axis and produces a 2D graph; this integration shows the effect of the light spot moving by at an even pace.
The analysis routine also sums the total intensity measured, and compares this to a baseline measurement of the LED with no lens. This output shows that about 90% of the light measured in the no-lens experiment makes it through this condenser lens.
>>> metrics_table = li.run_integration()
410_led_nolens_120mm_distance_60_measurements_3mm_step              5402781 100.0%
410_led_thorlabs_600_lens_120mm_distance_50_measurements_1mm_step   4812003 89.06%
After inspecting the spot graph, some first guesses at spacings are passed into a simulation routine. An ideal spacing minimizes the variation in light intensity. A reasonable guess starts with finding the width between the leading and trailing 50% intensity points; depending on the convex/concave shape of these edges, the overlapping sections should roughly complement each other and add back to 100%.
This graph compares several spacings; the original, along with 14, 16, 18, and 20mm spacings. The 50% intensity-width was about 18mm.
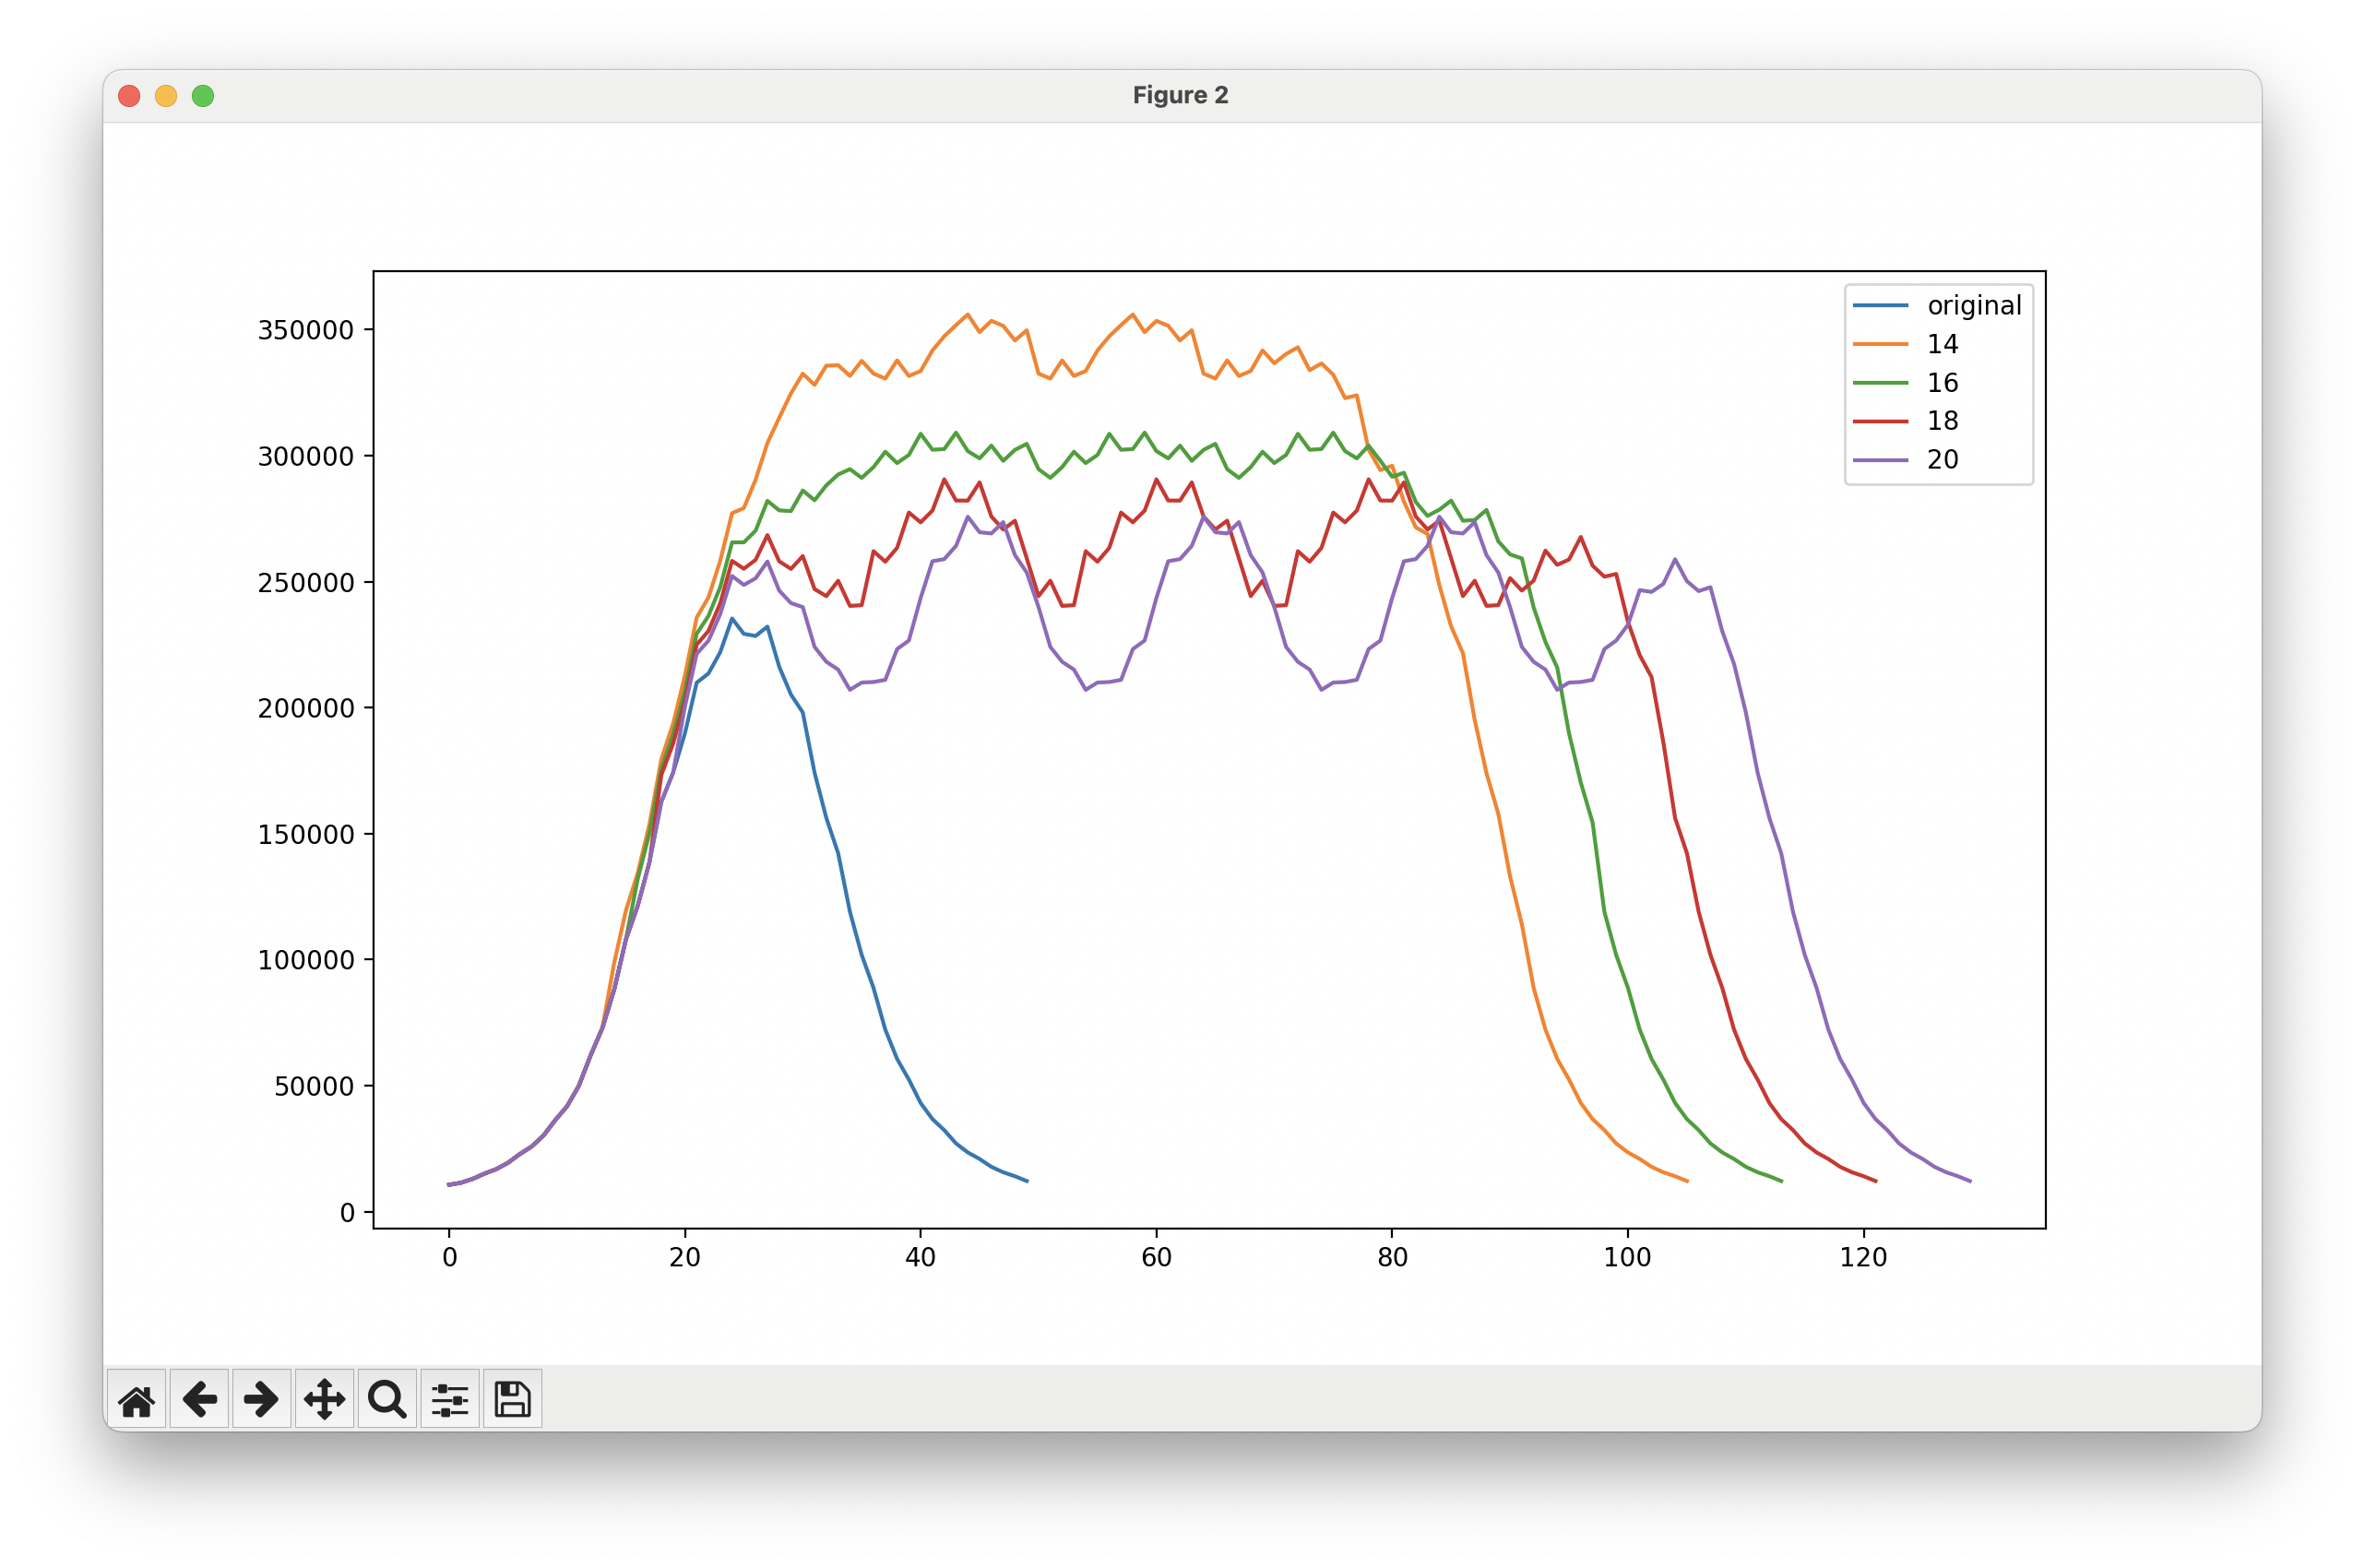
The 16mm spacing is the most consistent. A numerical report output in the interpreter compares different spacings across a sampling window (40 to 70mm here):
>>> light_spot, integrated_spot, cumulative_intensity = metrics_table['410_led_thorlabs_600_lens_120mm_distance_50_measurements_1mm_step']
>>> spacing_table = li.apply_spacings(integrated_spot, [14, 16, 18, 20])
>>> li.analyze_plot_spacing(spacing_table, sample_start=40, sample_end=70)
================
For spacing: 14
Min-Max Delta:      7.69%
Min:                330558
Average:            103.86% (343308)
Max:                107.69% (355983)
Standard deviation: 2.527
================
For spacing: 16
Min-Max Delta:      6.17%
Min:                291146
Average:            103.35% (300890)
Max:                106.17% (309101)
Standard deviation: 1.618
================
For spacing: 18
Min-Max Delta:      20.89%
Min:                240360
Average:            112.09% (269409)
Max:                120.89% (290575)
Standard deviation: 5.693
================
For spacing: 20
Min-Max Delta:      33.17%
Min:                207049
Average:            119.76% (247959)
Max:                133.17% (275730)
Standard deviation: 9.371
The 16mm spacing achieves an excellent min-max variation of 6%. From previous exposure experiments and discussions with other exposure unit designers, a reasonable ceiling for light variation in an exposure unit that can still achieve good results is 20-25%. The difference between the 16mm and 18mm spacings is significant, despite this being a very small spatial change. This suggests that this measurement and simulation approach was a good one!
All lenses successfully tested so far have their spacings listed here. (An excellent bunch of new lenses await testing!)
| Lens | Diameter | Spacing | Min-Max Variation | Min Radiation Value | Cost | Code/SKU |
|---|---|---|---|---|---|---|
| Thor Labs Aspheric Condenser | 1” | 16mm | 6.17% | 291146 | $20 | ACL25416U |
| Adafruit Convex Lens | 40mm | 40mm | 18.26% | 113475 | $6 | 3853 |
| Carclo 10108 | 26.5mm | 20mm is ideal, up to 25mm | 5.69% | 335216 | $2.96 | 10108 |
| Carclo 10391 | 26.5mm | 11mm | 3.48% | 656359 | $2.18 | 10391 |
| No lens! | ~ | 30mm, 15mm | 5.42% | 19450 | ~ | ~ |
Some lenses did not succeed in achieving the goal variation limit of 20% or less:
| Lens | Diameter | Cost | Best Spacing | Min-Max Variation |
|---|---|---|---|---|
| Thor Labs fresnel | 2” | $36.54 | 34mm | 32% |
| Six Seasons/Amazon 50mm fresnel | 50mm | $6 | 38mm | 35% |
The results for the 50mm fresnel lens from Six Seasons is particularly disappointing; its collimation quality was excellent for its cost, maintaining its spot shape over 6 feet. One observation, from comparing the fresnel graphs with those that performed better, is that flat or concave edges overlap well, while convex lines (like those in the fresnel plots) do not. Future work may involve synthesizing a mask shape to selectively remove light to address lenses that did not space well.
Overall, this measurement approach turned out to have many benefits:
- many different spacings can be tested, without setting up a screen; the measurements are available indefinitely, for further analysis and simulation
- the light shape can be visualized in a 3D graph, bringing some intuition-building and an inspection process for the measurement; the lens alignment and measurement design can be checked, as small issues with centering, focal length, and tilt create slumps and skews in the light shape
- once an exposure scanning speed has been successfully established for one lens, calculating scanning speeds for the remaining lenses is straightforward: the intensity measurements have relative meaning across different lenses. This also reduces the cost of evaluating a lens, because only one lens is needed to take measurements, while several are needed for an exposure test
- the cumulative intensity of a lens spot is easy to calculate, helping evaluate lens materials and value. Some lens materials and coatings transmit UV light differently: acrylic fresnel lenses achieve excellent collimation at low cost, but acrylic blocks a significant percentage of UV light (about 60% gets through the Thor 2” fresnel lens). Other lenses are available with a specialized coating for increased UV transmission, but at higher cost. While the acrylic lenses need an evalution of collimation quality and a mask to work well, the UV coating from Thor Labs only bumped transmission by a few percentage points.
Photo Shoot!
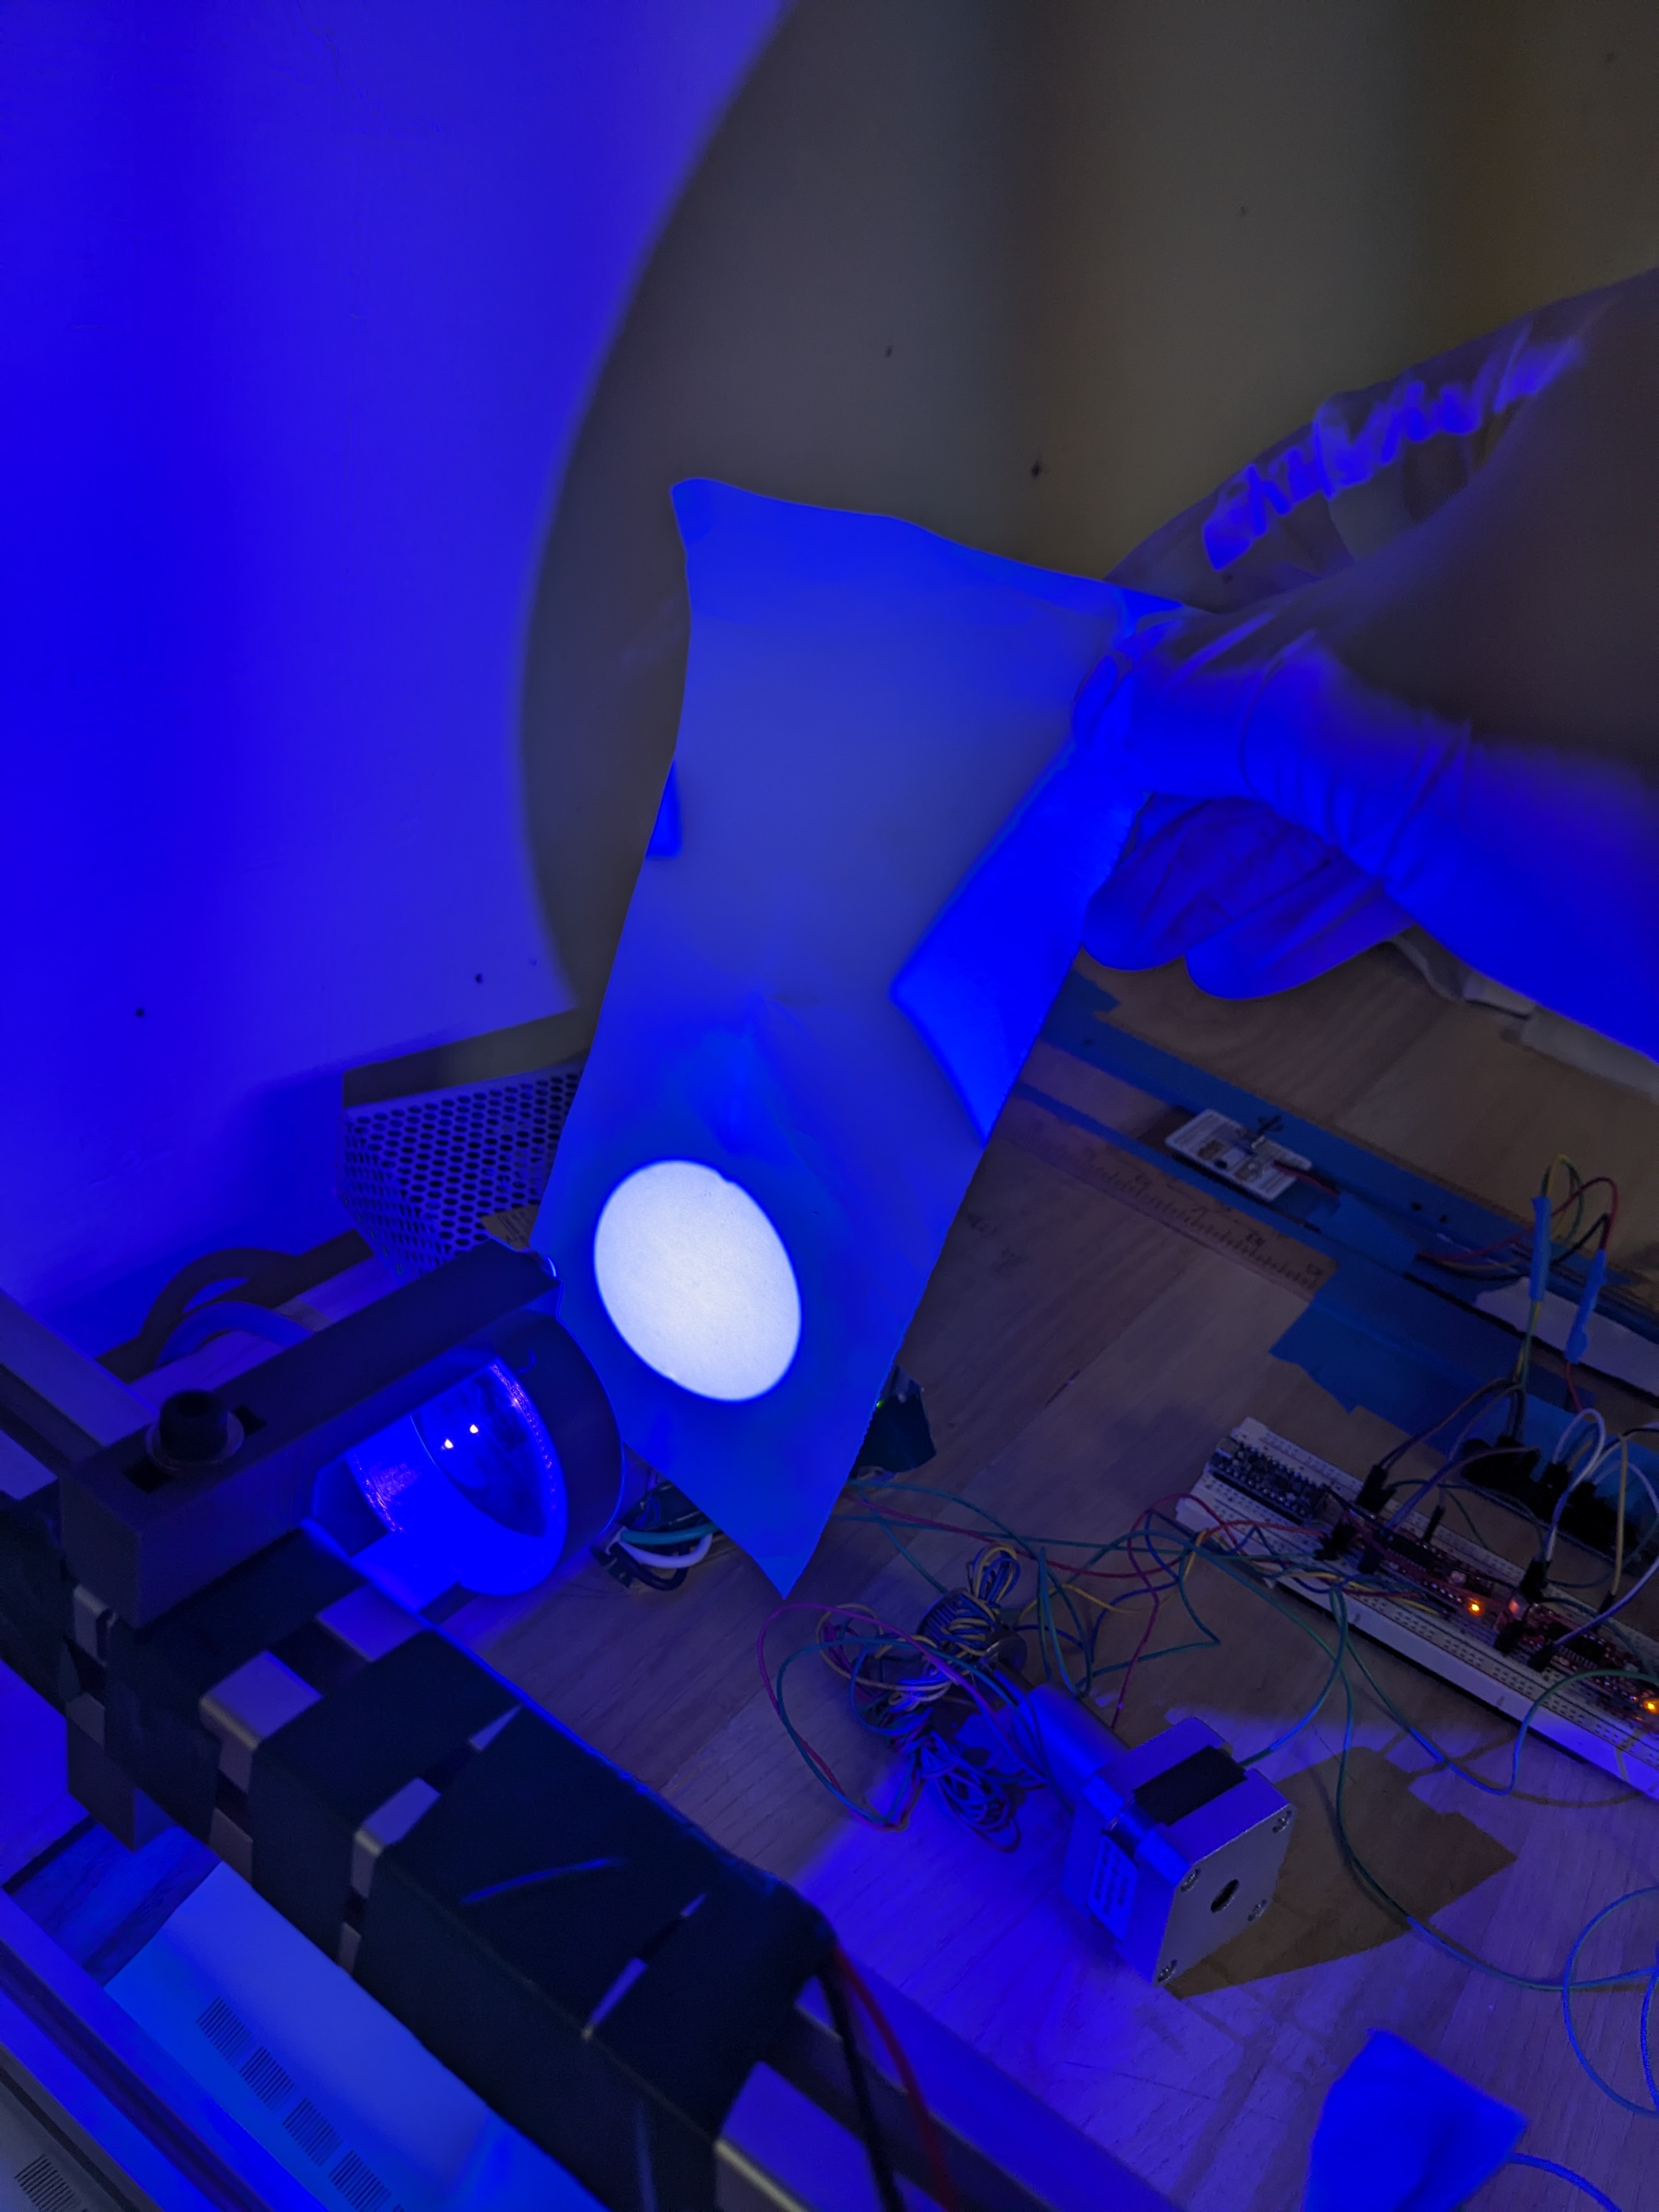 This fresnel lens had an excellent spot-test and collimated well, but was naively chosen with a focal length much too long for an LED (50mm, for a 50mm diameter lens); this allows much of the light to escape from the side – about 1/3 of the light measured with a 32mm focal length fresnel of the same diameter. Between this and the UV-absorbency of acrylic, 40% of the LED’s light makes it into the spot.
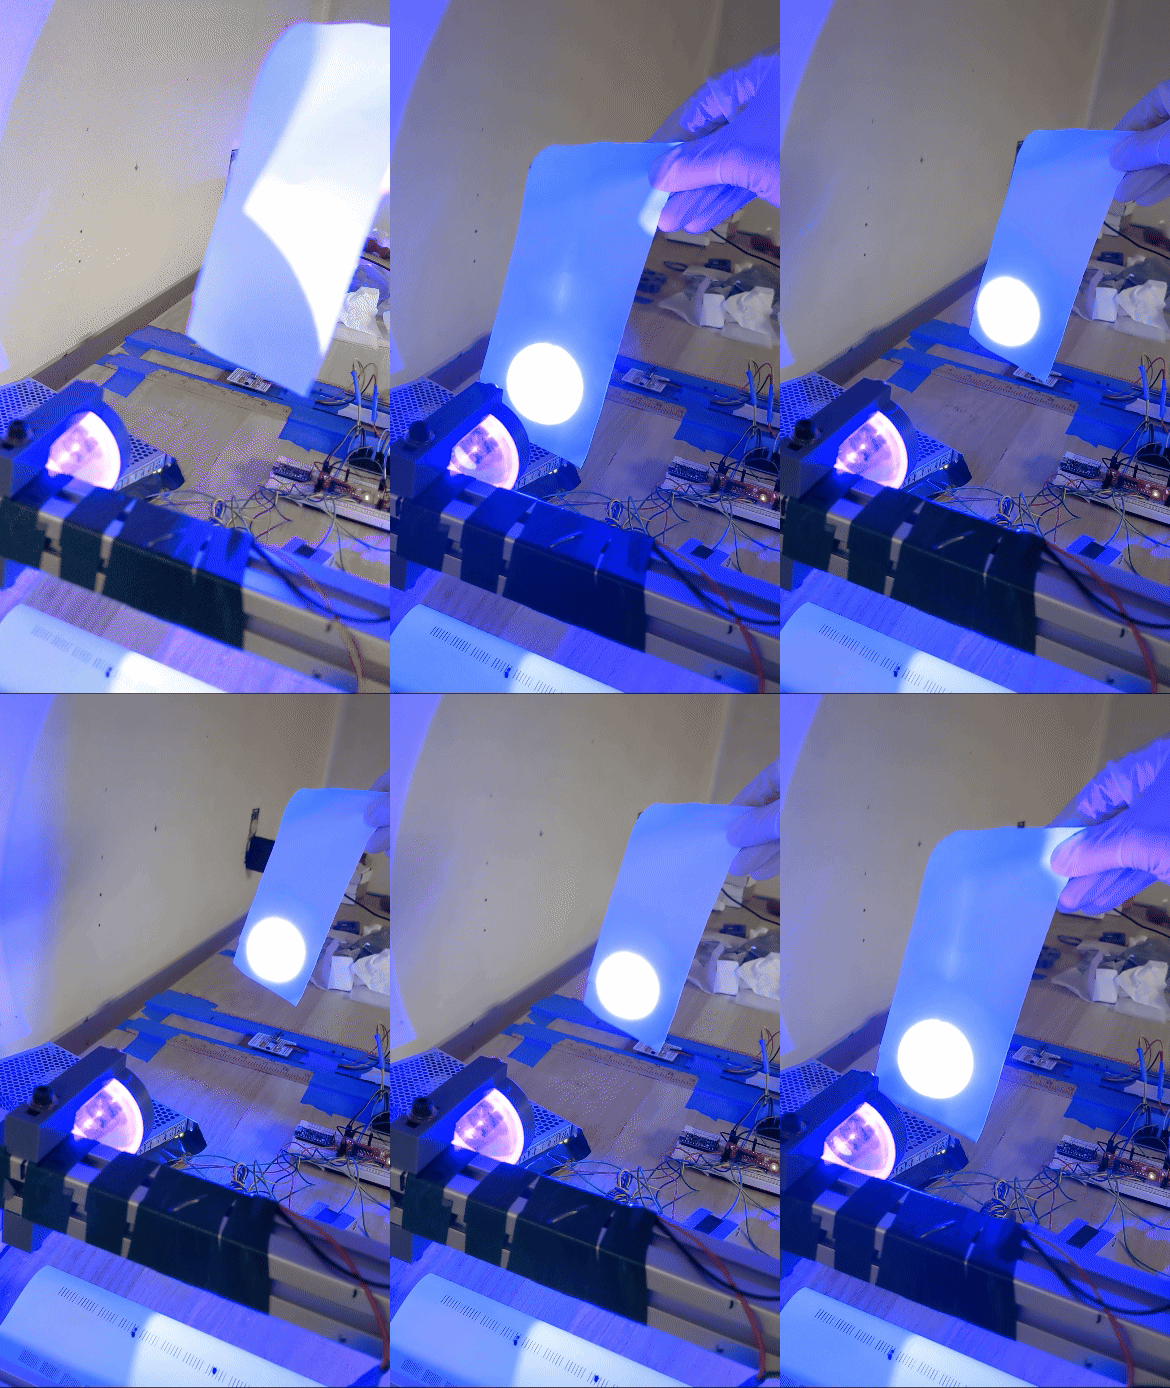
A spot test for checking collimation.
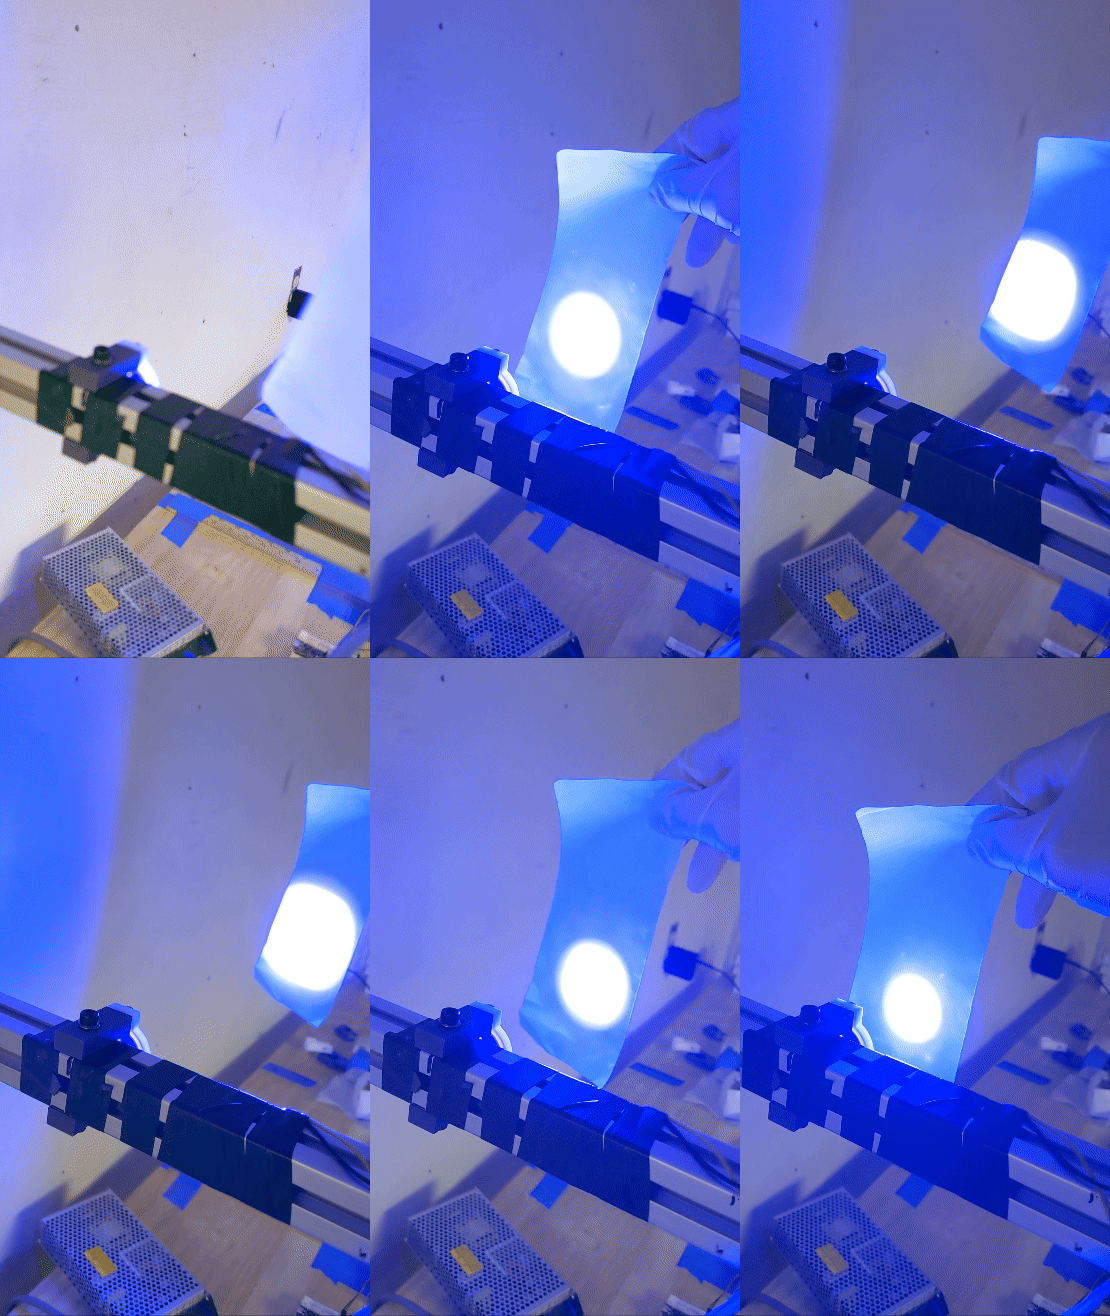
An out-of-focus lens changes the spot size and quality rapidly.
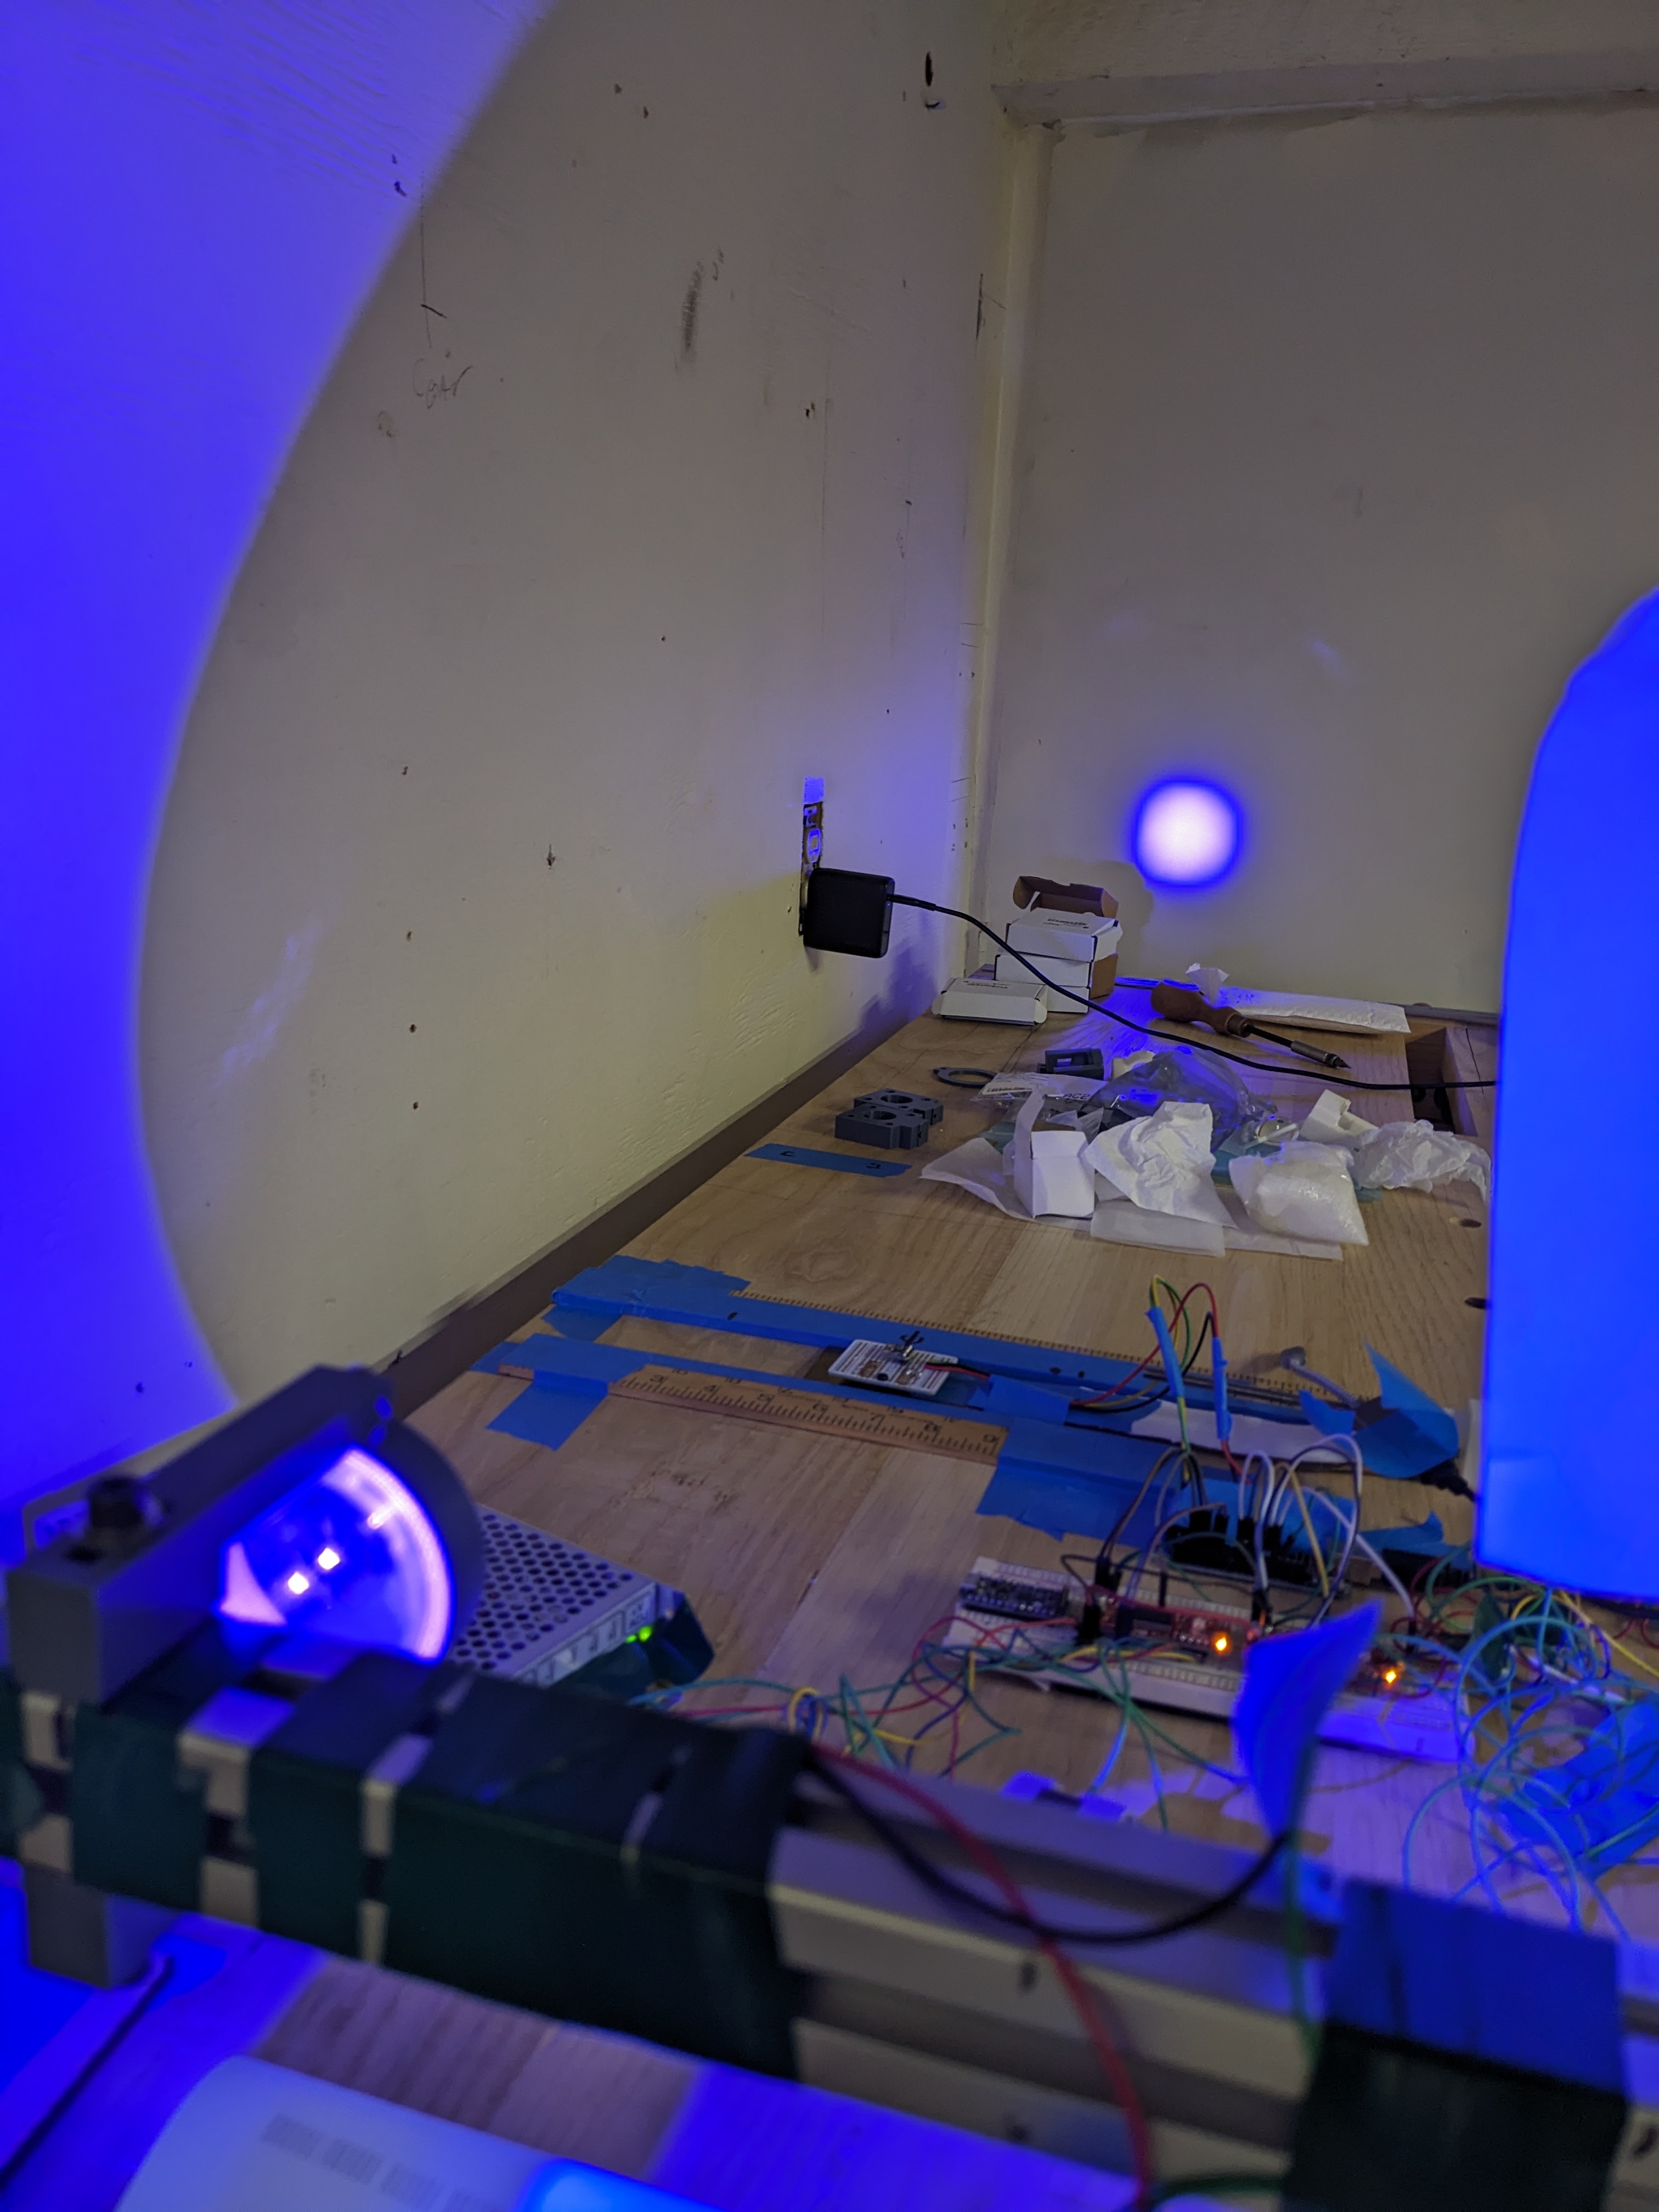 Some lenses, like this fresnel lens, could keep their shape over 6 feet or so. Meausuring the spot distance from further away made focal length adjustments more accurate.
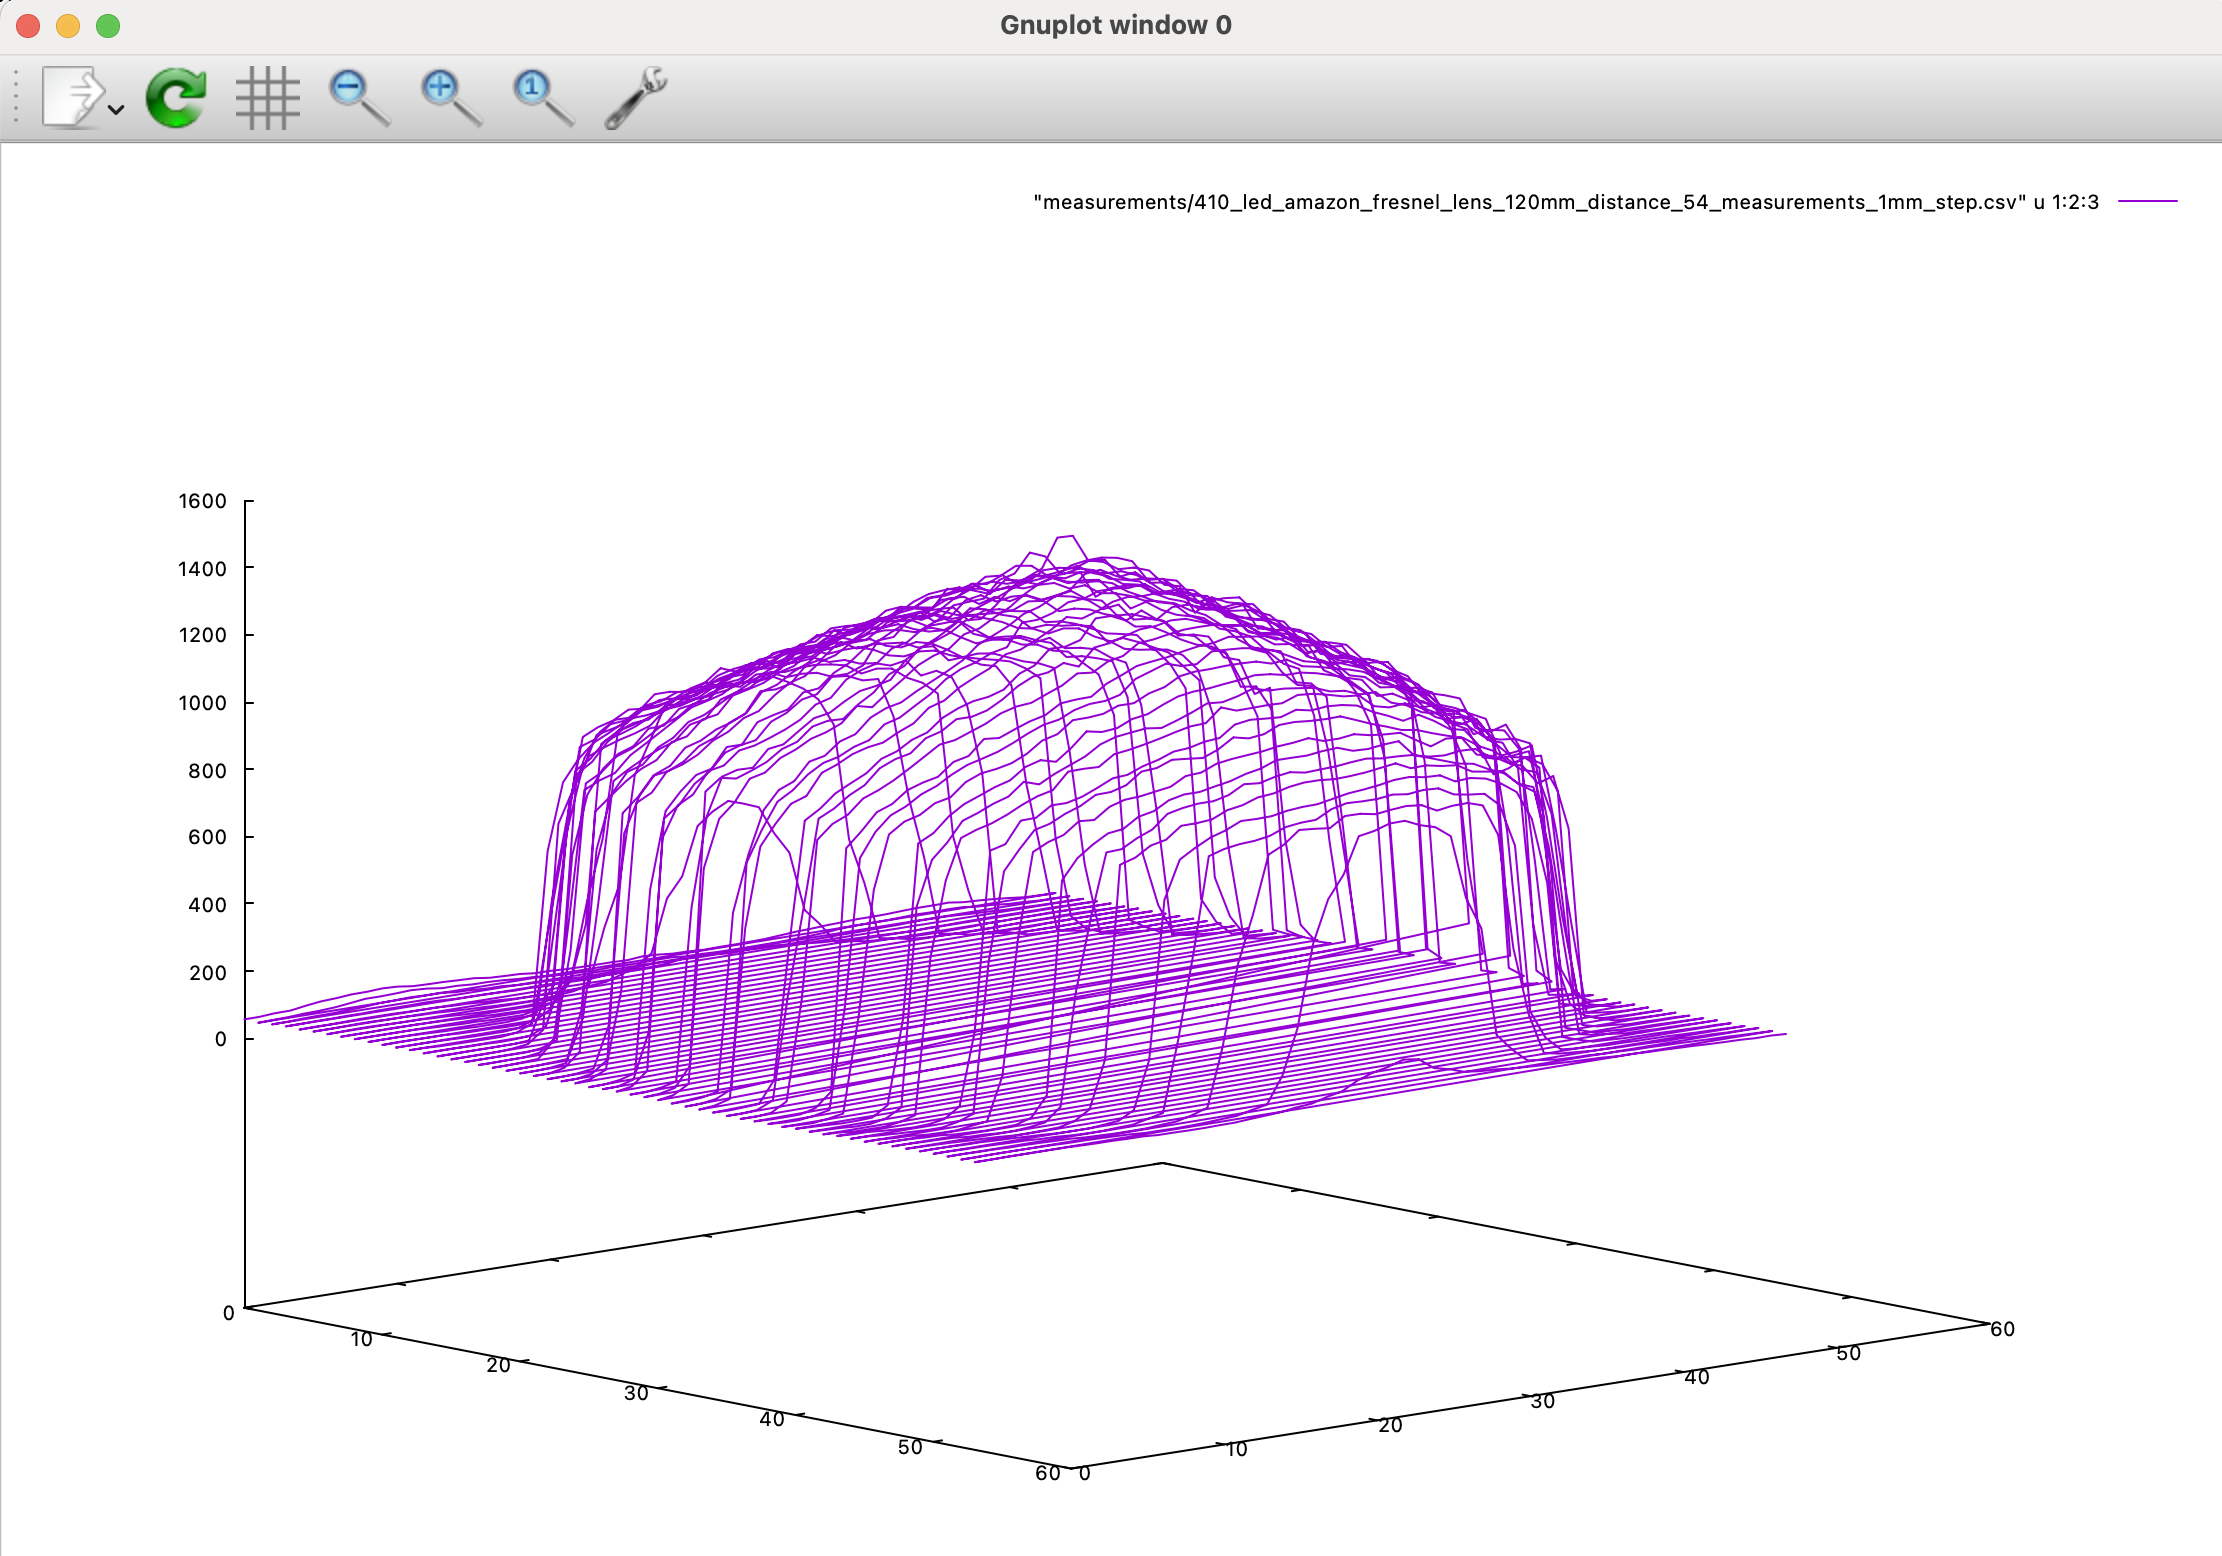 While the fresnel spot test and collimation looked promising, the 3D plot showed signs of trouble: the spot didn’t taper off quickly enough.
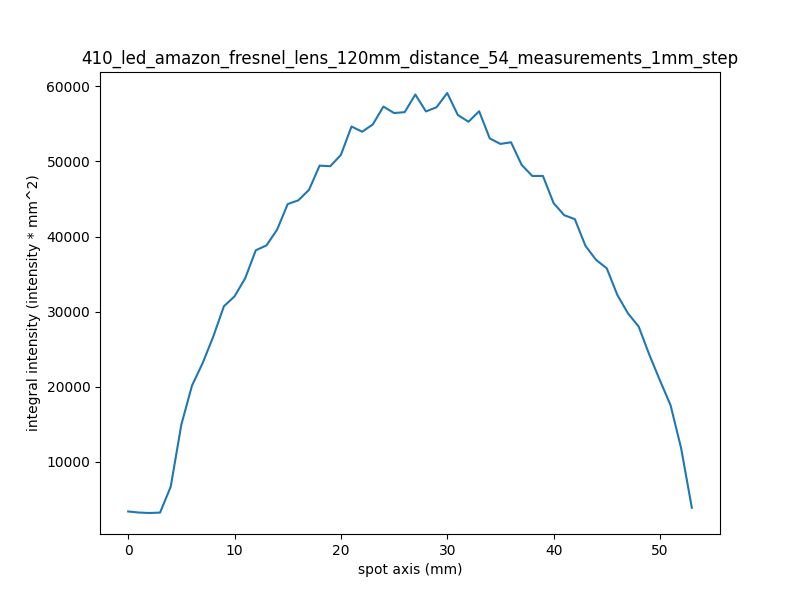 In the 2D integration graph of the fresnel, the sides have convex edges. This turned out to make it difficult to combine. The other fresnel tested (a Thor lens with a 32mm focal length) also had this issue.
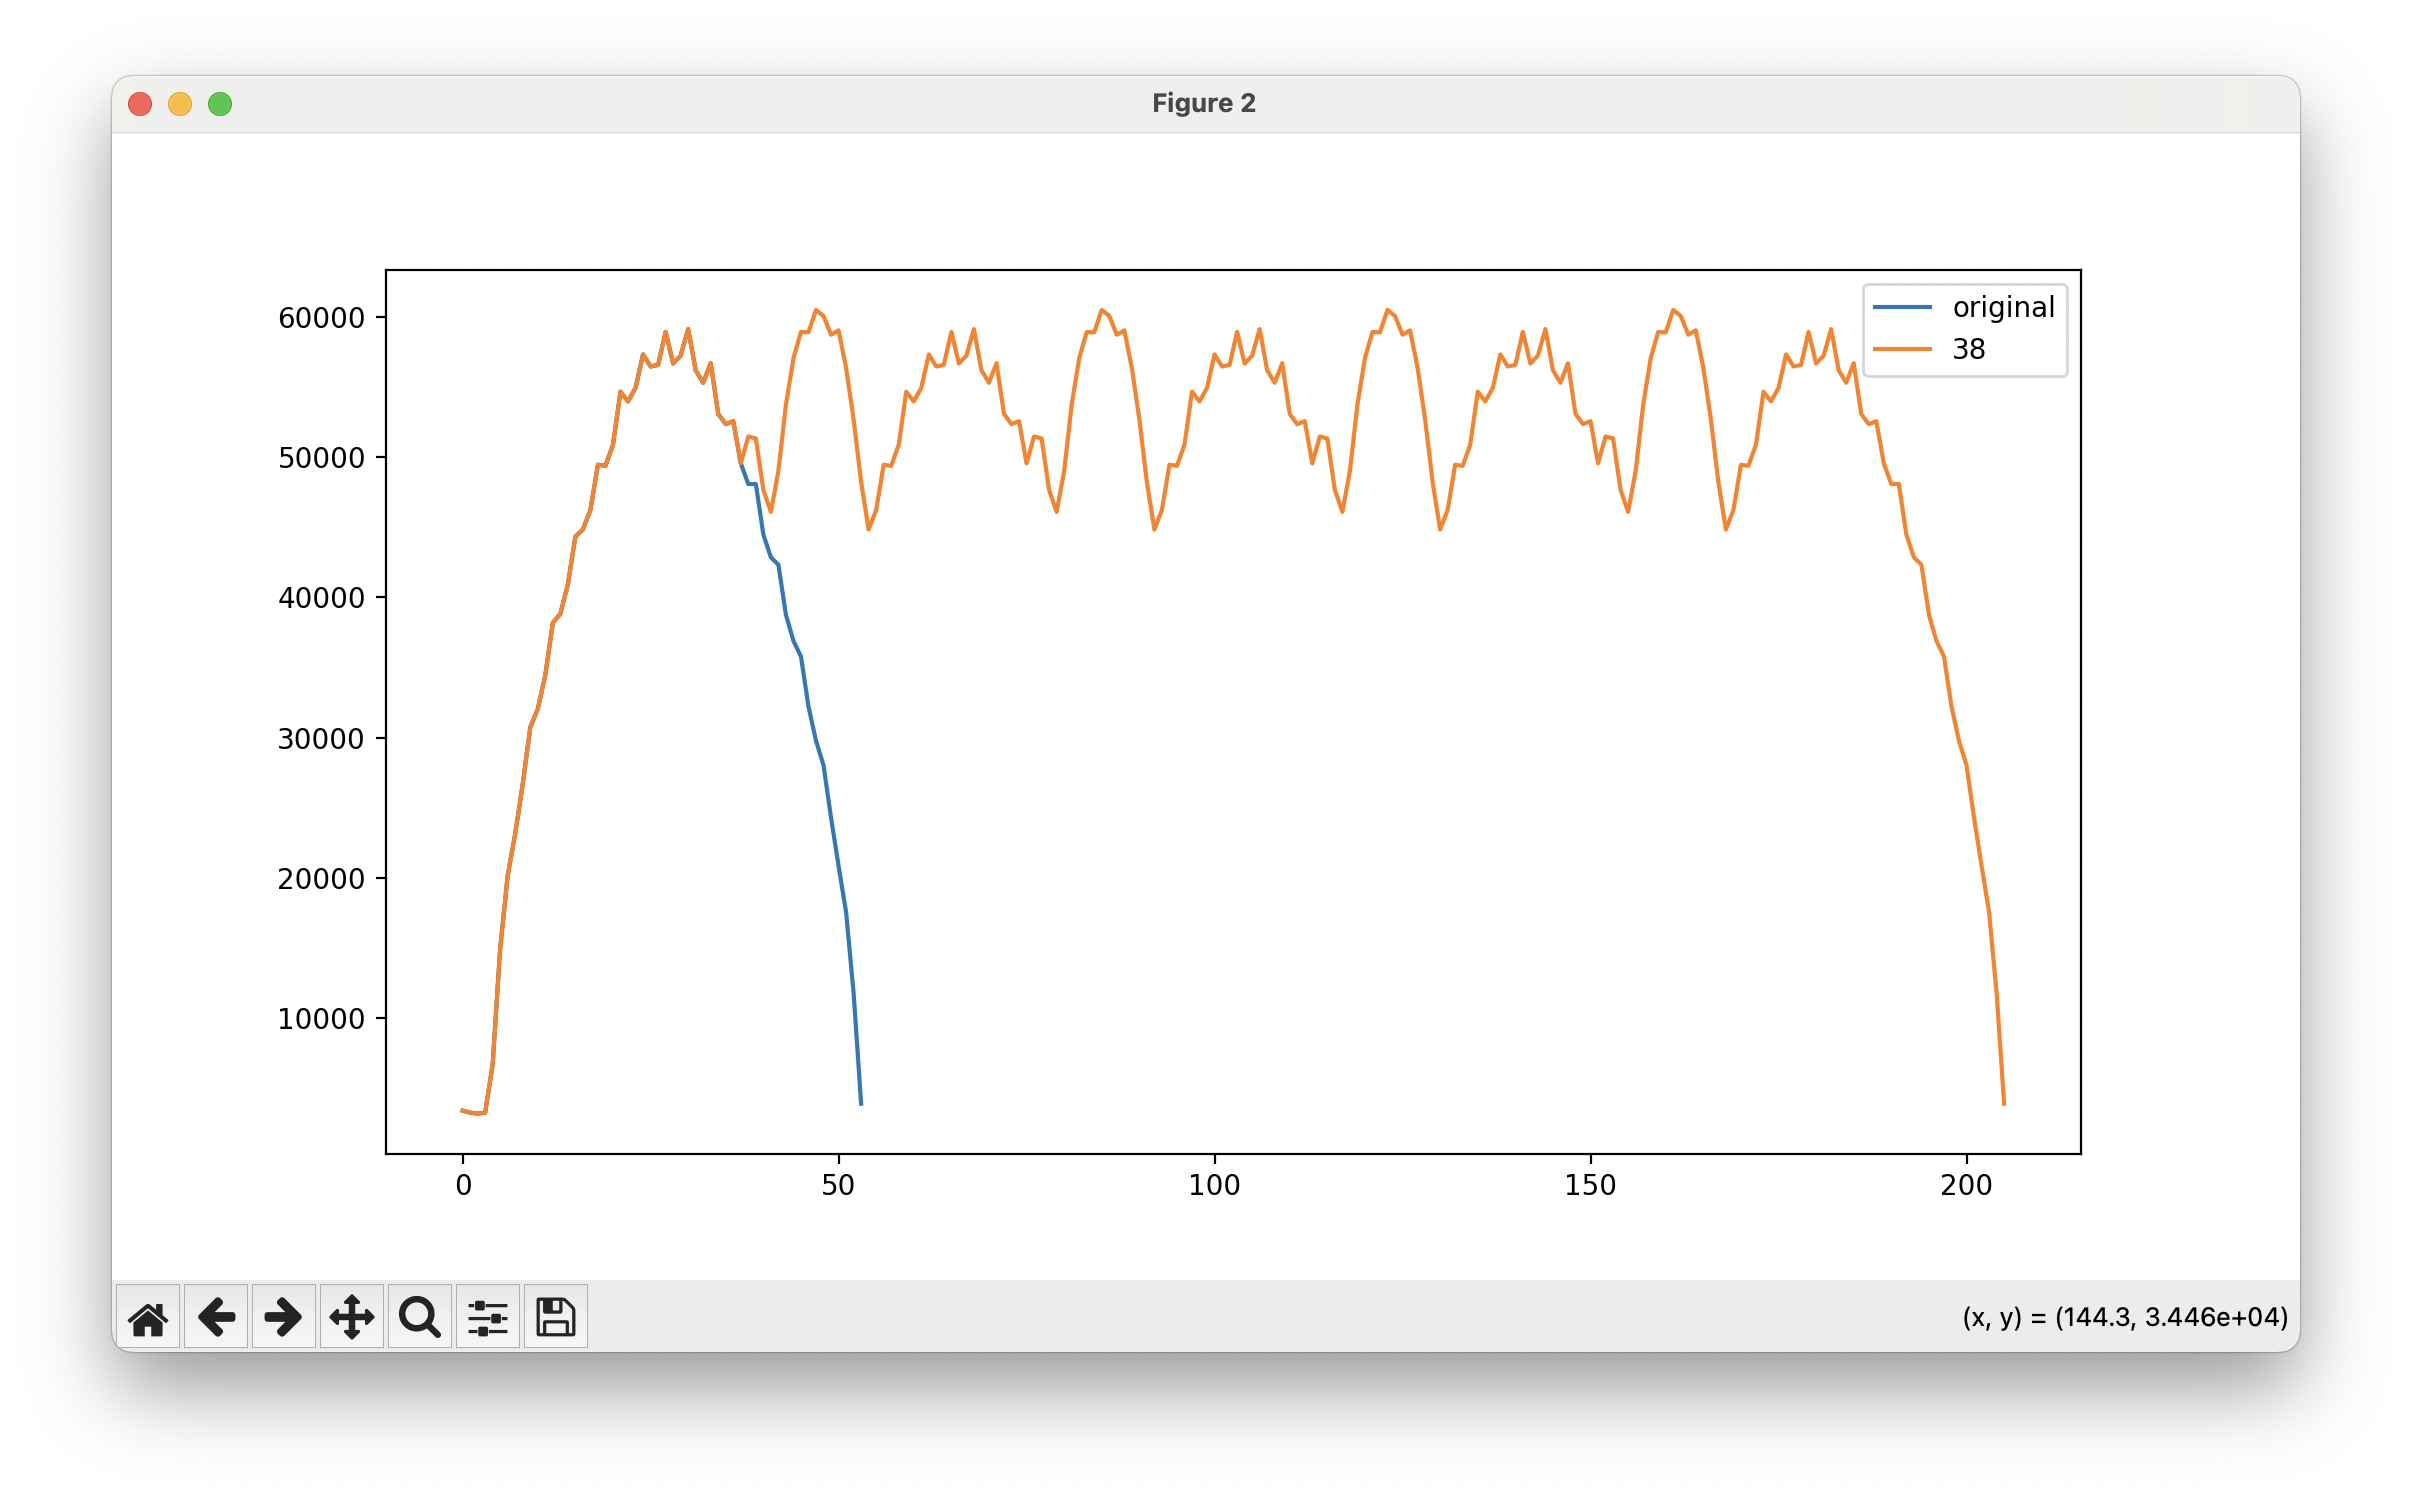 In its simulated spacing, the fresnel’s convex edges make it impossible to combine lights evenly; any closer, and the overlapping spike grows; any farther apart, and the valleys between become too deep.
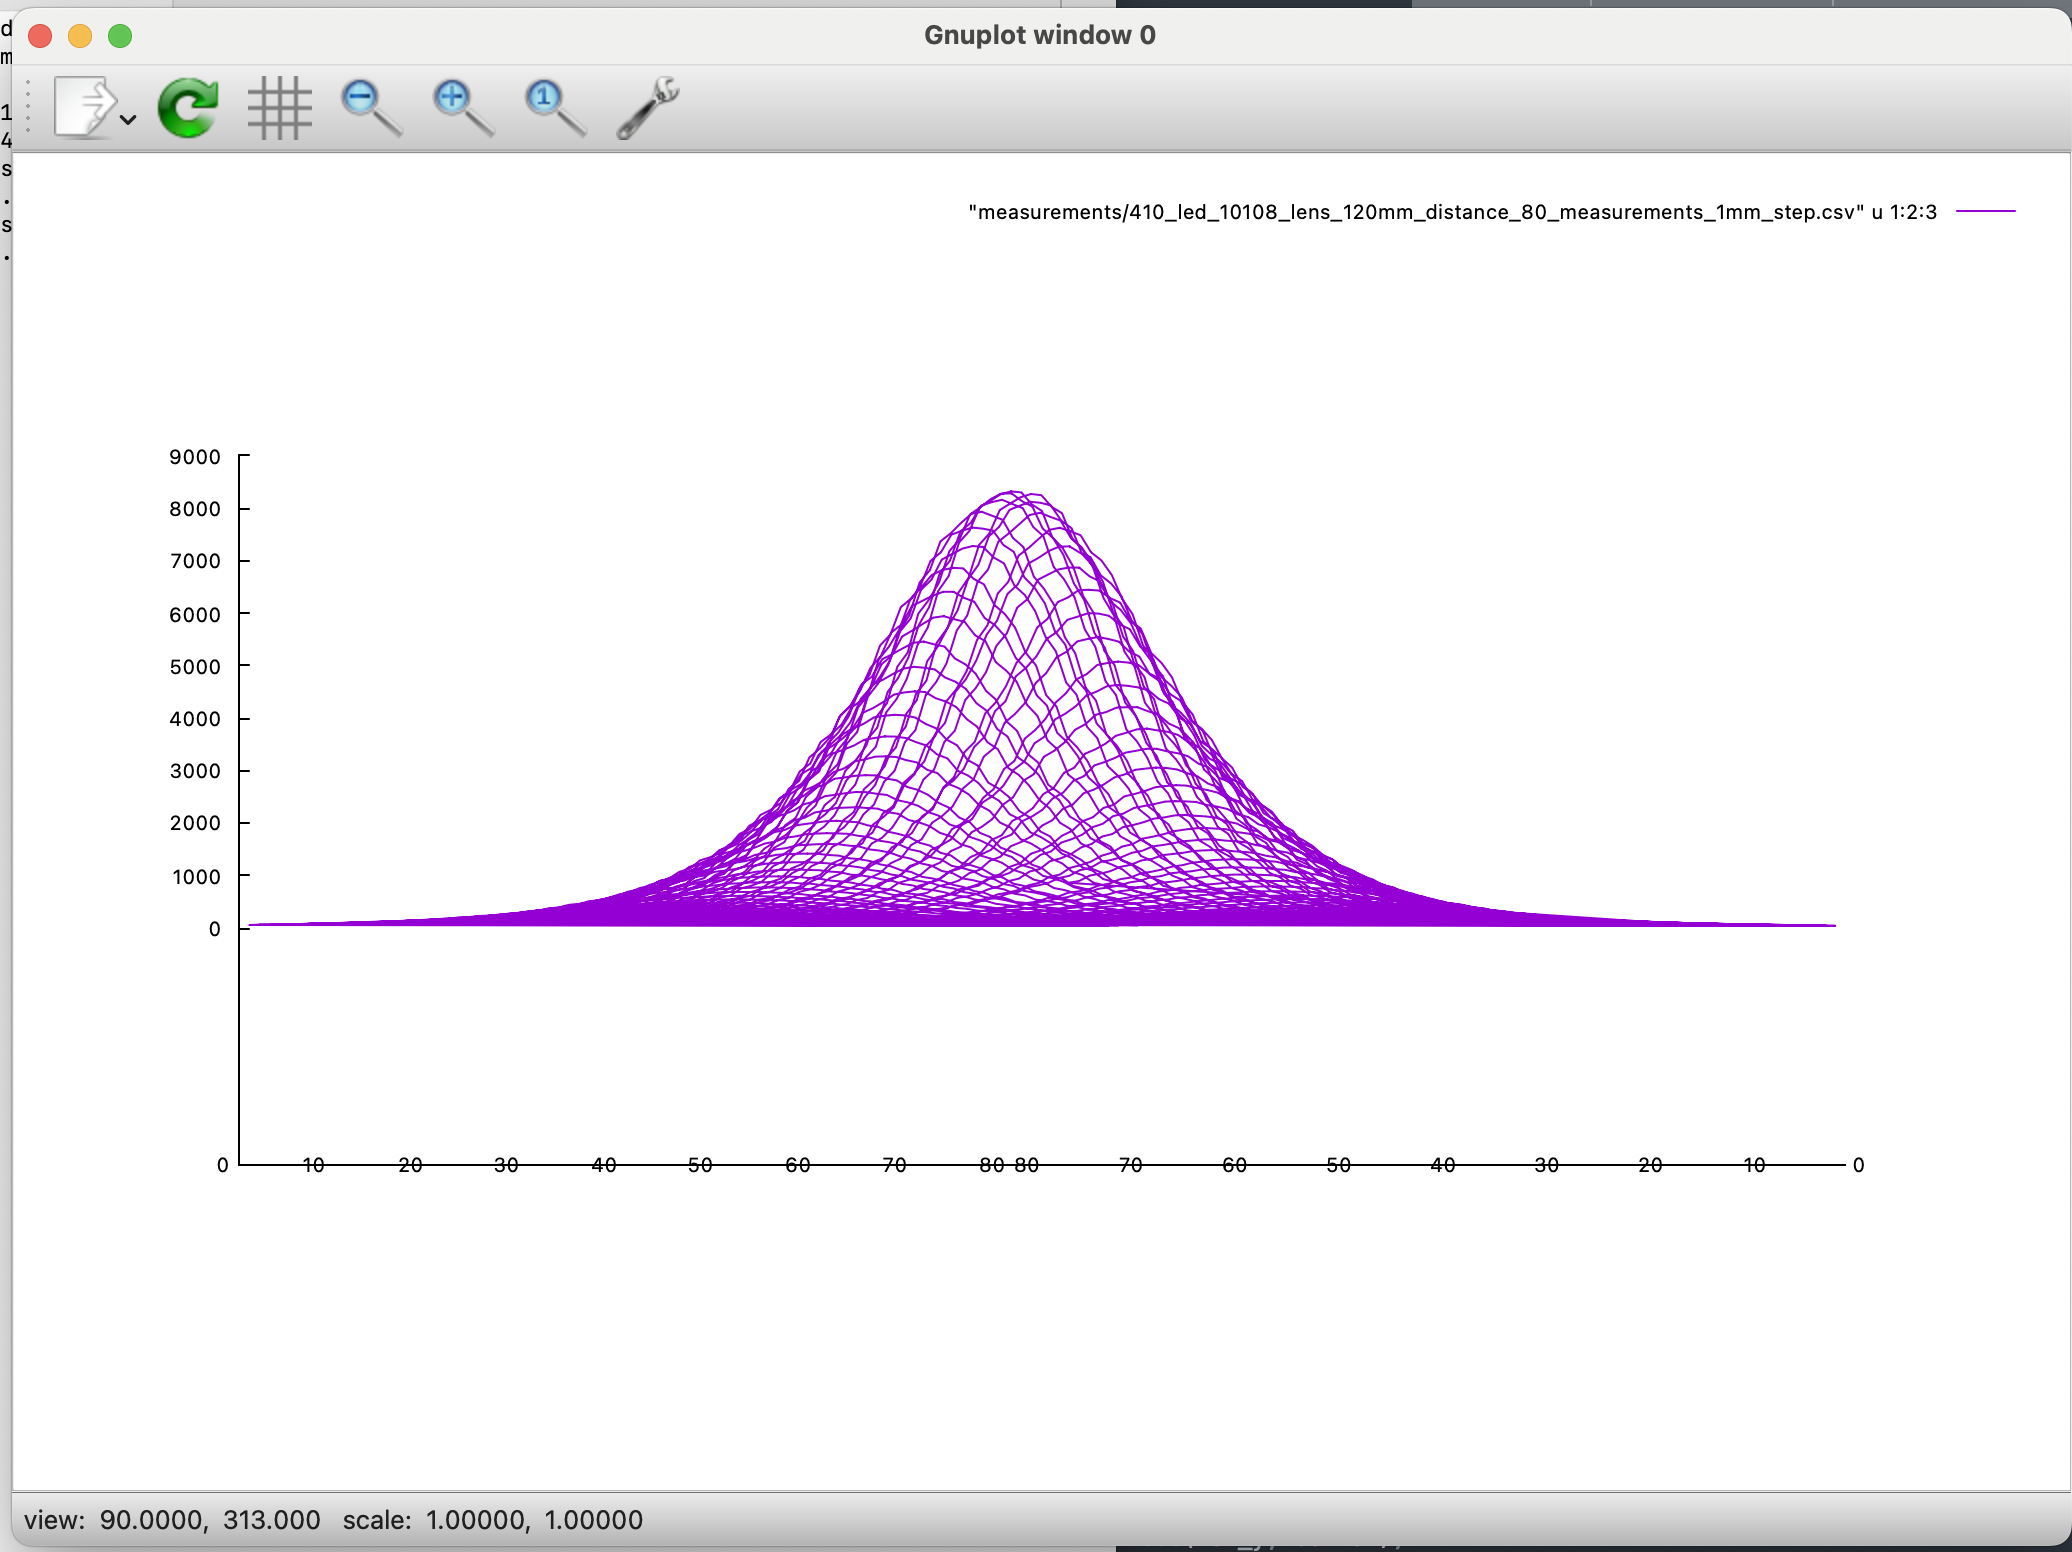 Two of the most successful lenses, the Carclo 10108 and the Thor condenser lens, had parabolic shapes at their peaks with a concave taper at the base.
 The Thor aspheric condensers projected a little too well; the die imaged, and made focusing difficult.
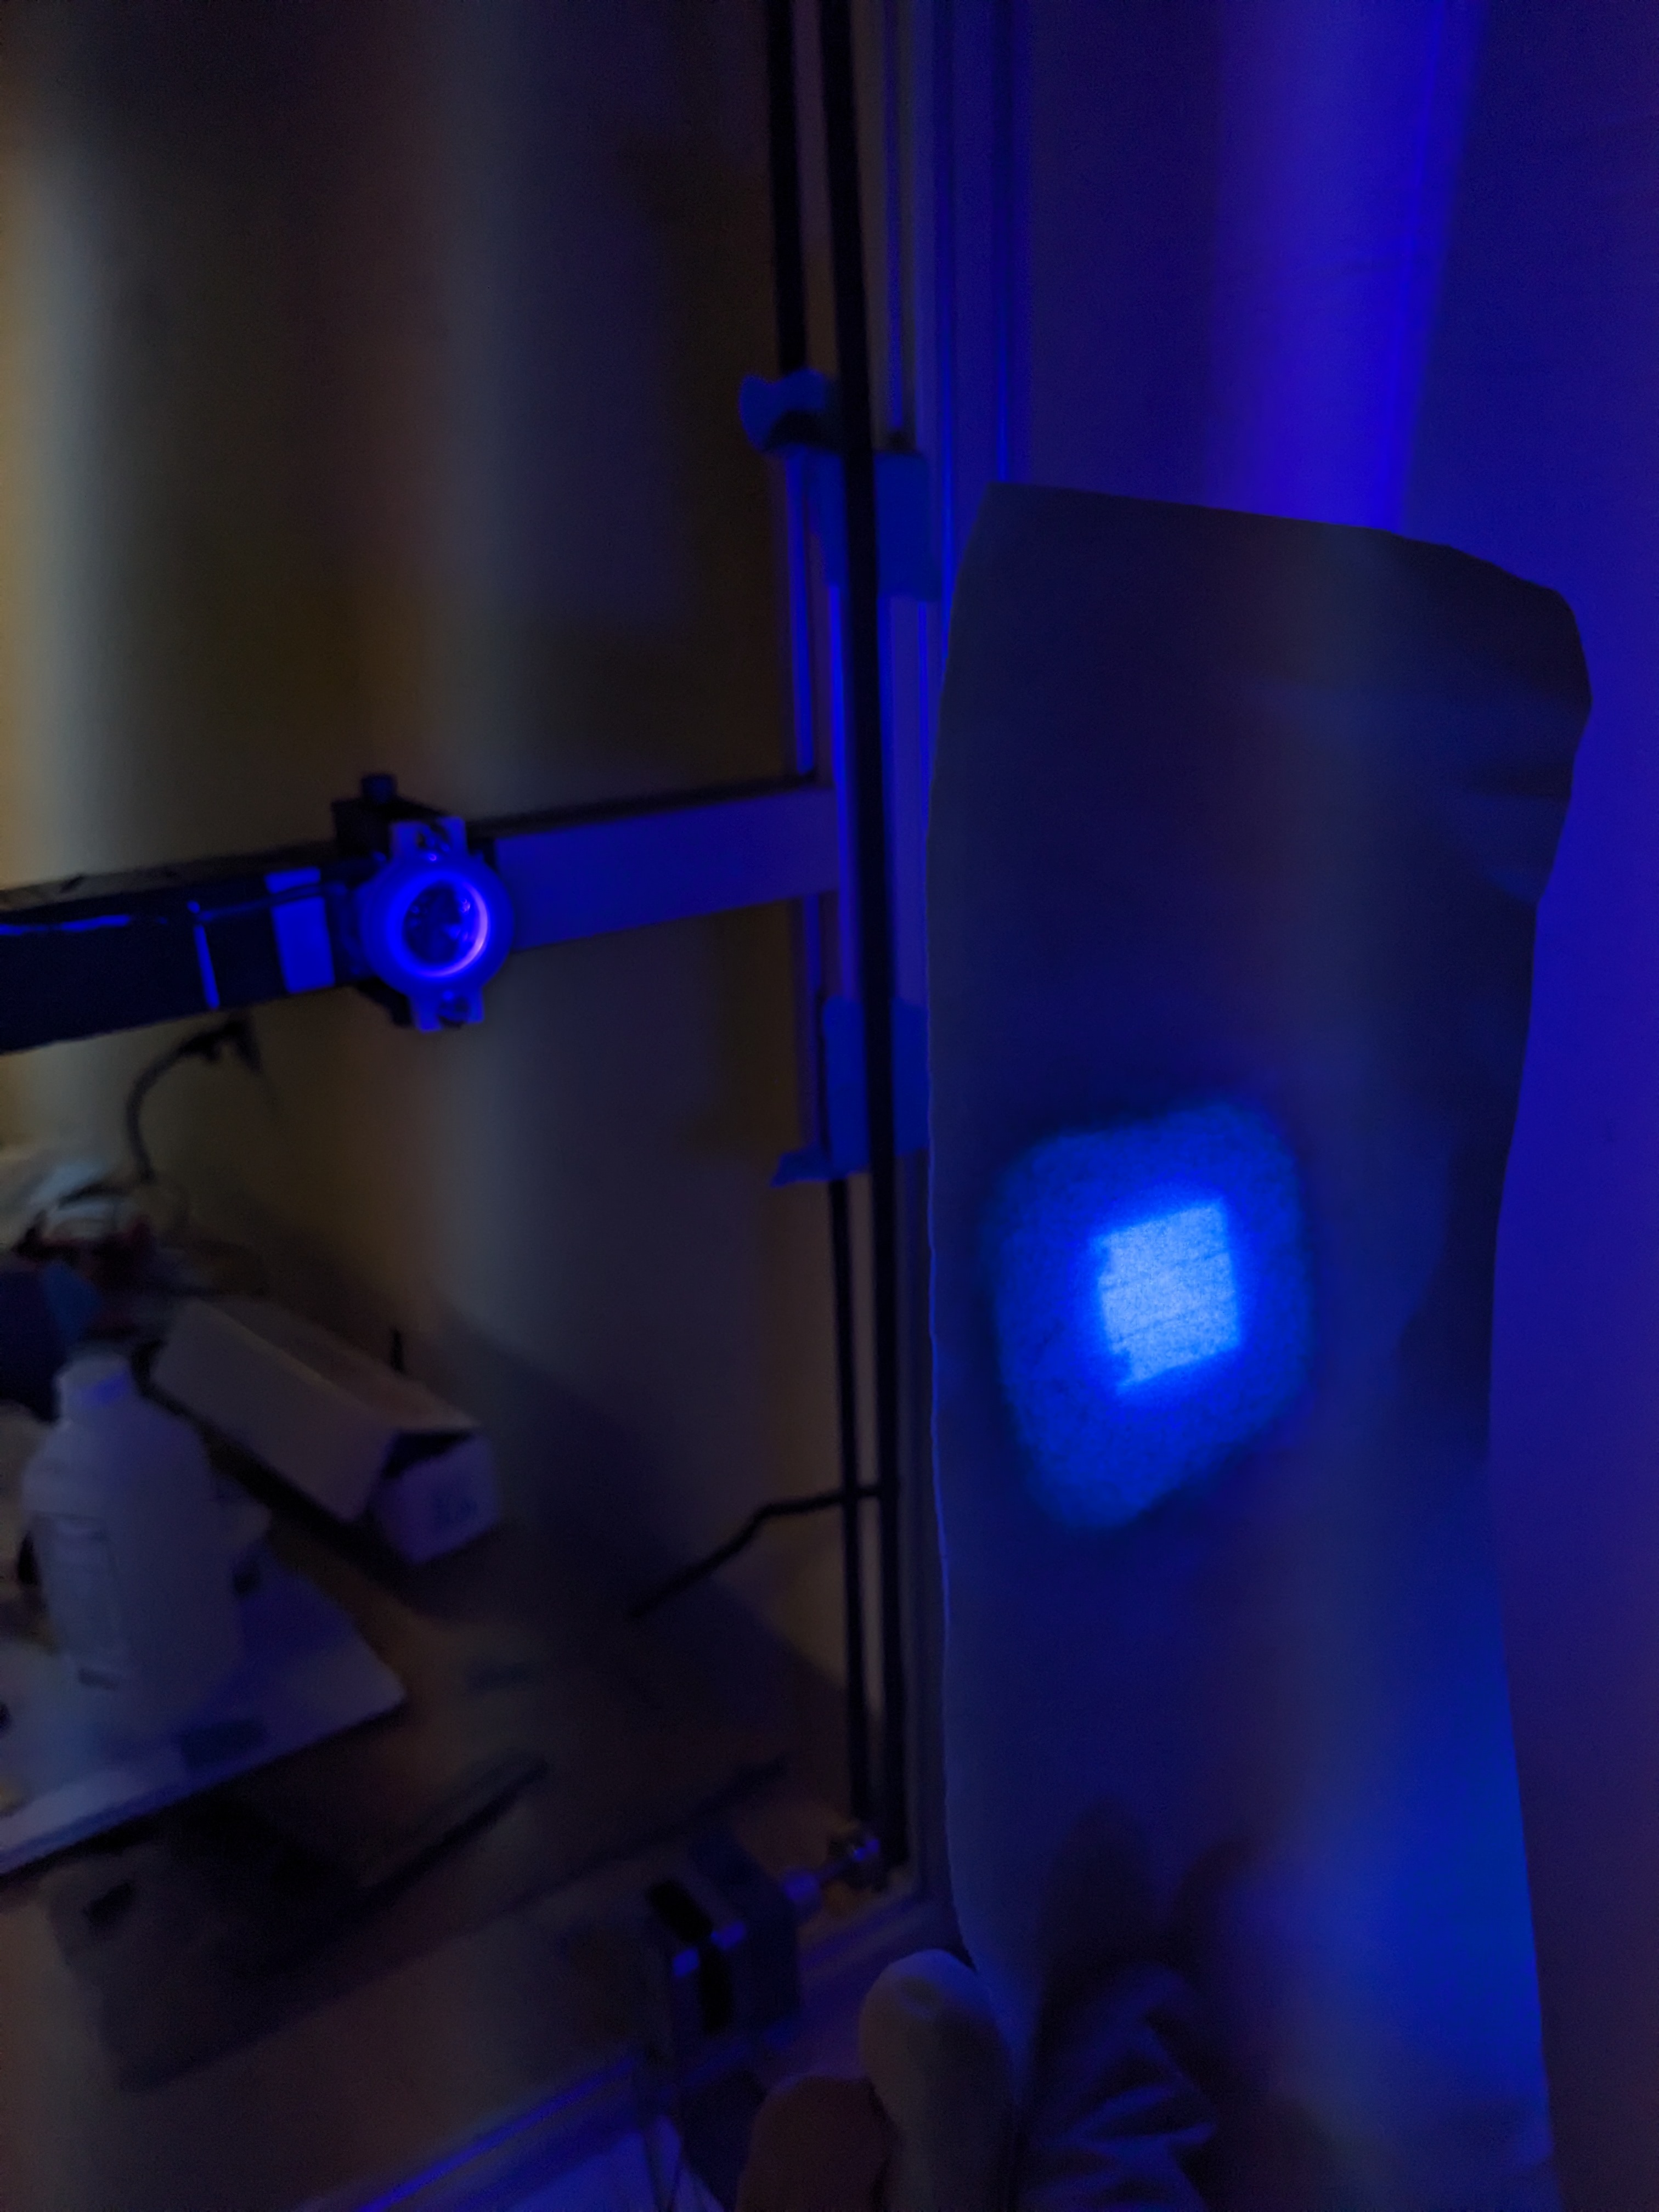
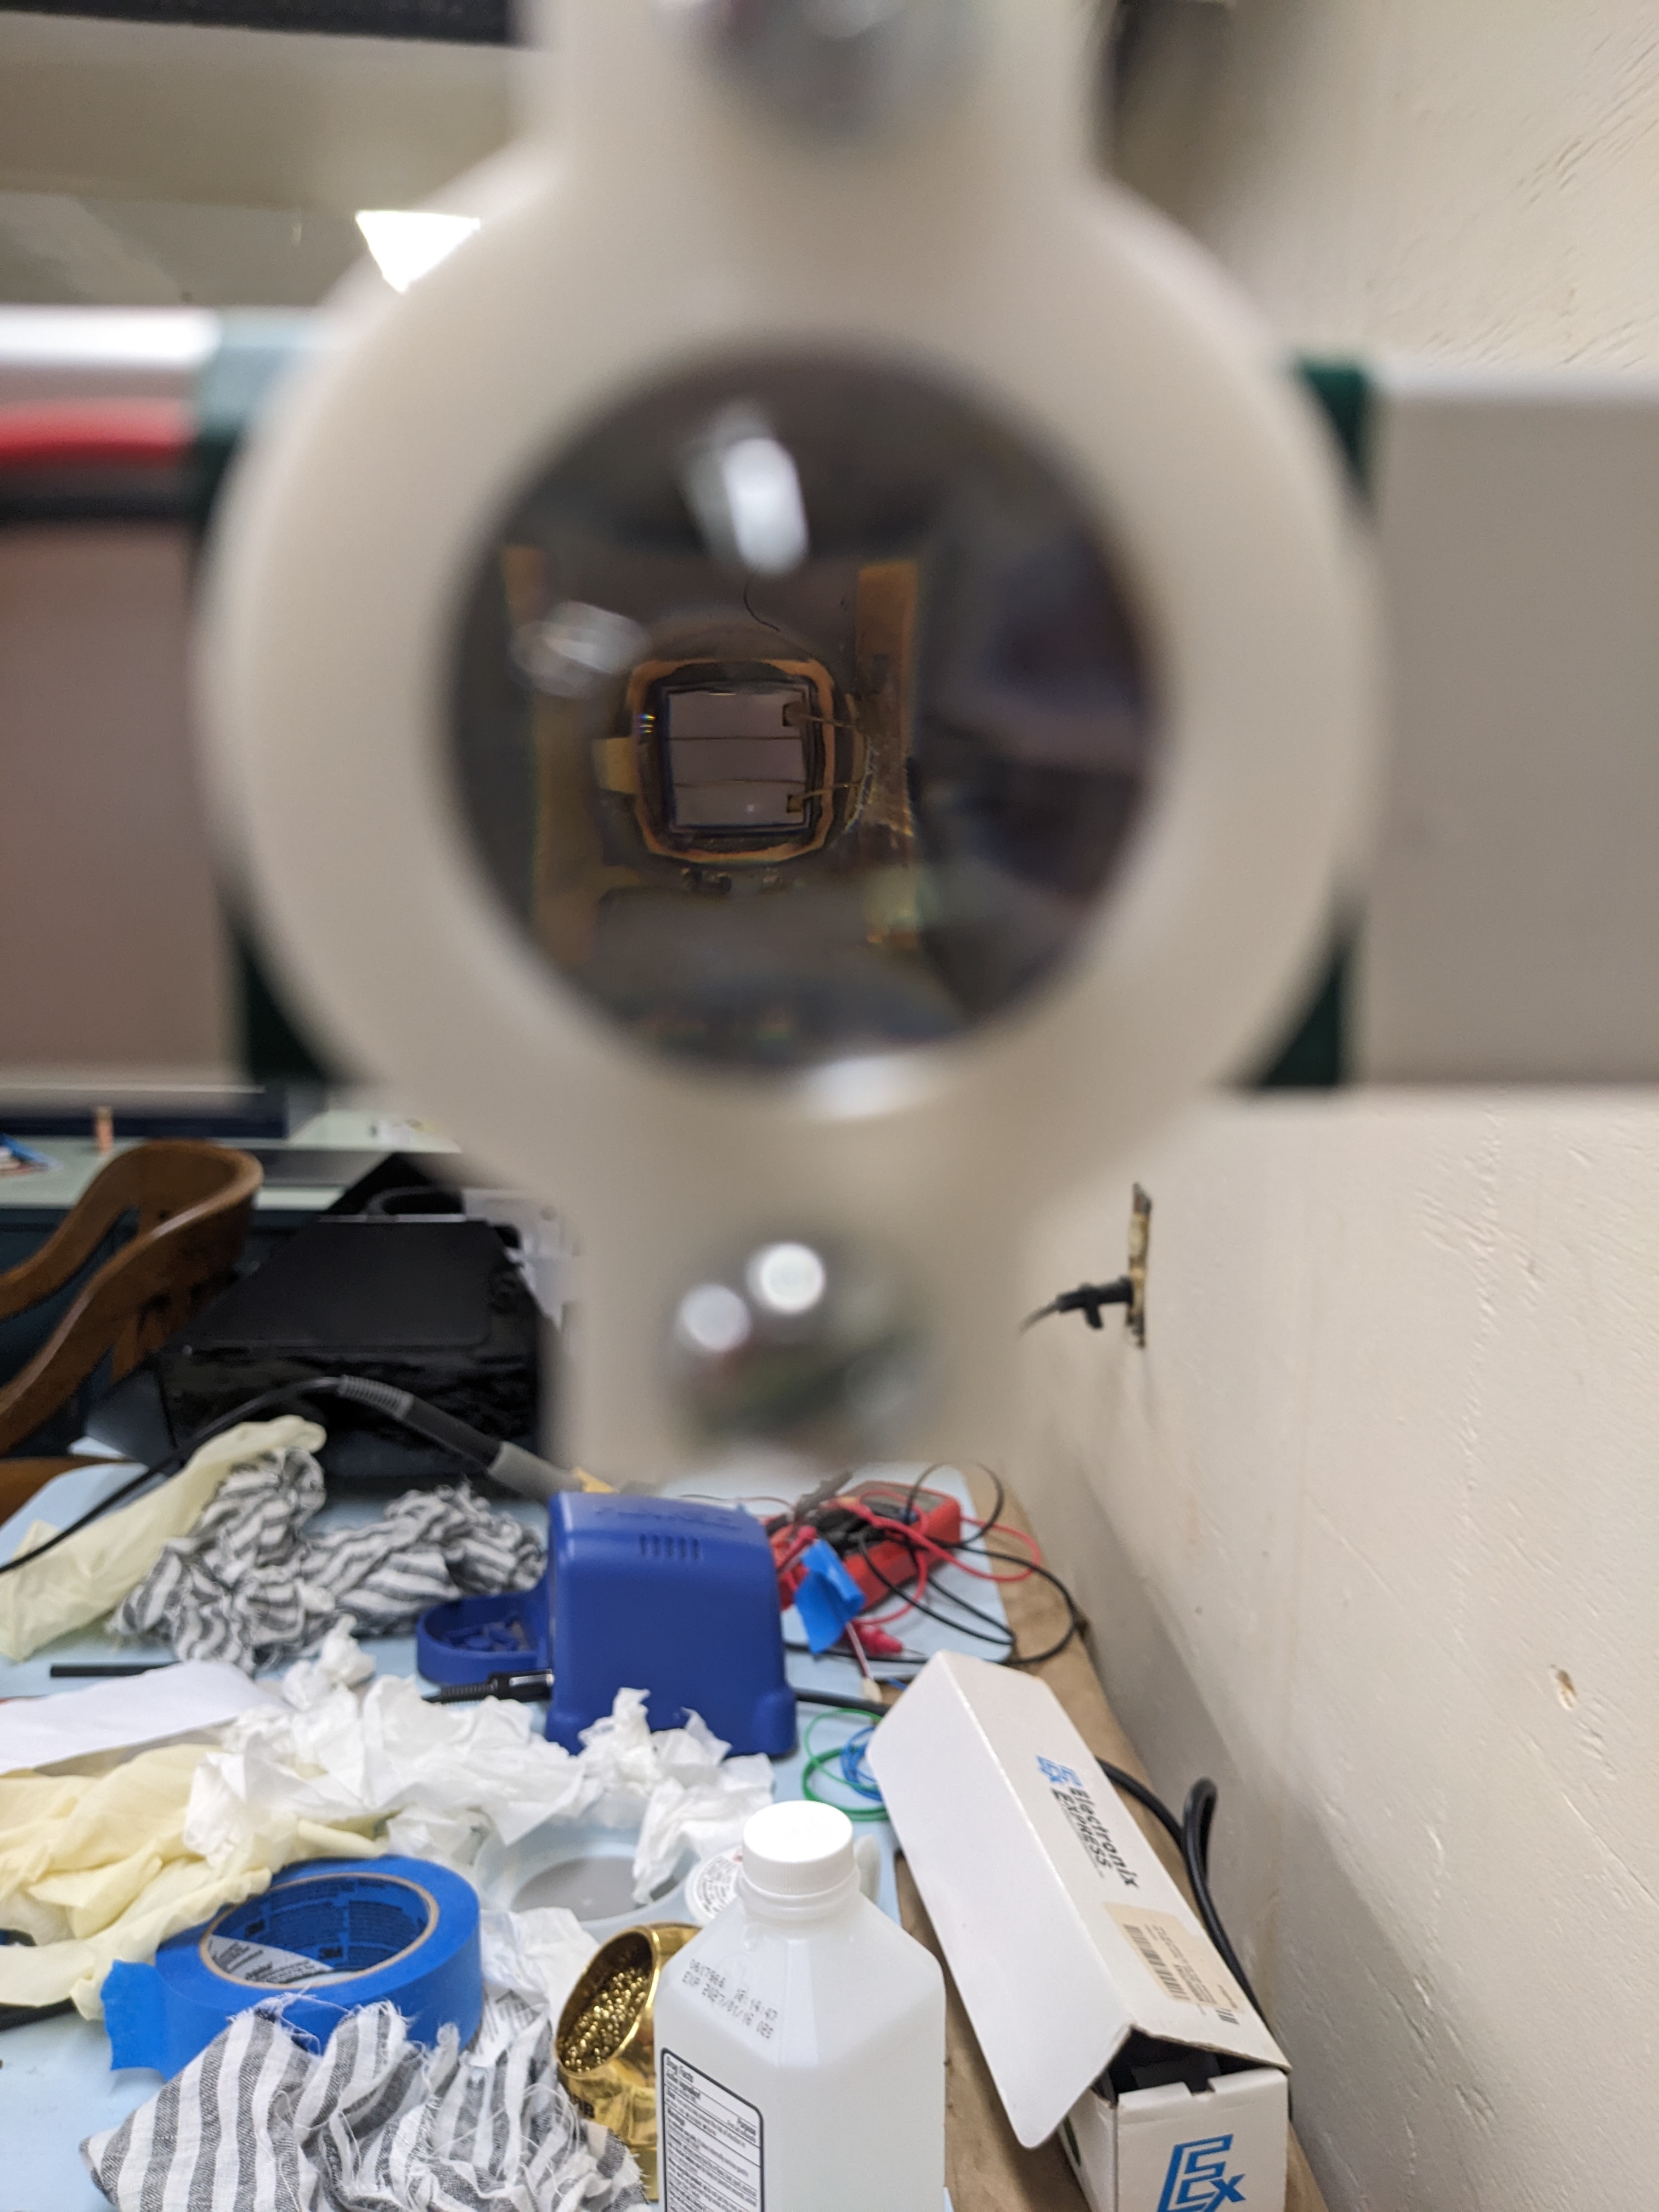 In reverse, the lens magnifies the LED itself. Lenses like these are used in projectors and enlargers, to take an image produced by a chip or a slide and magnify it over a distance.
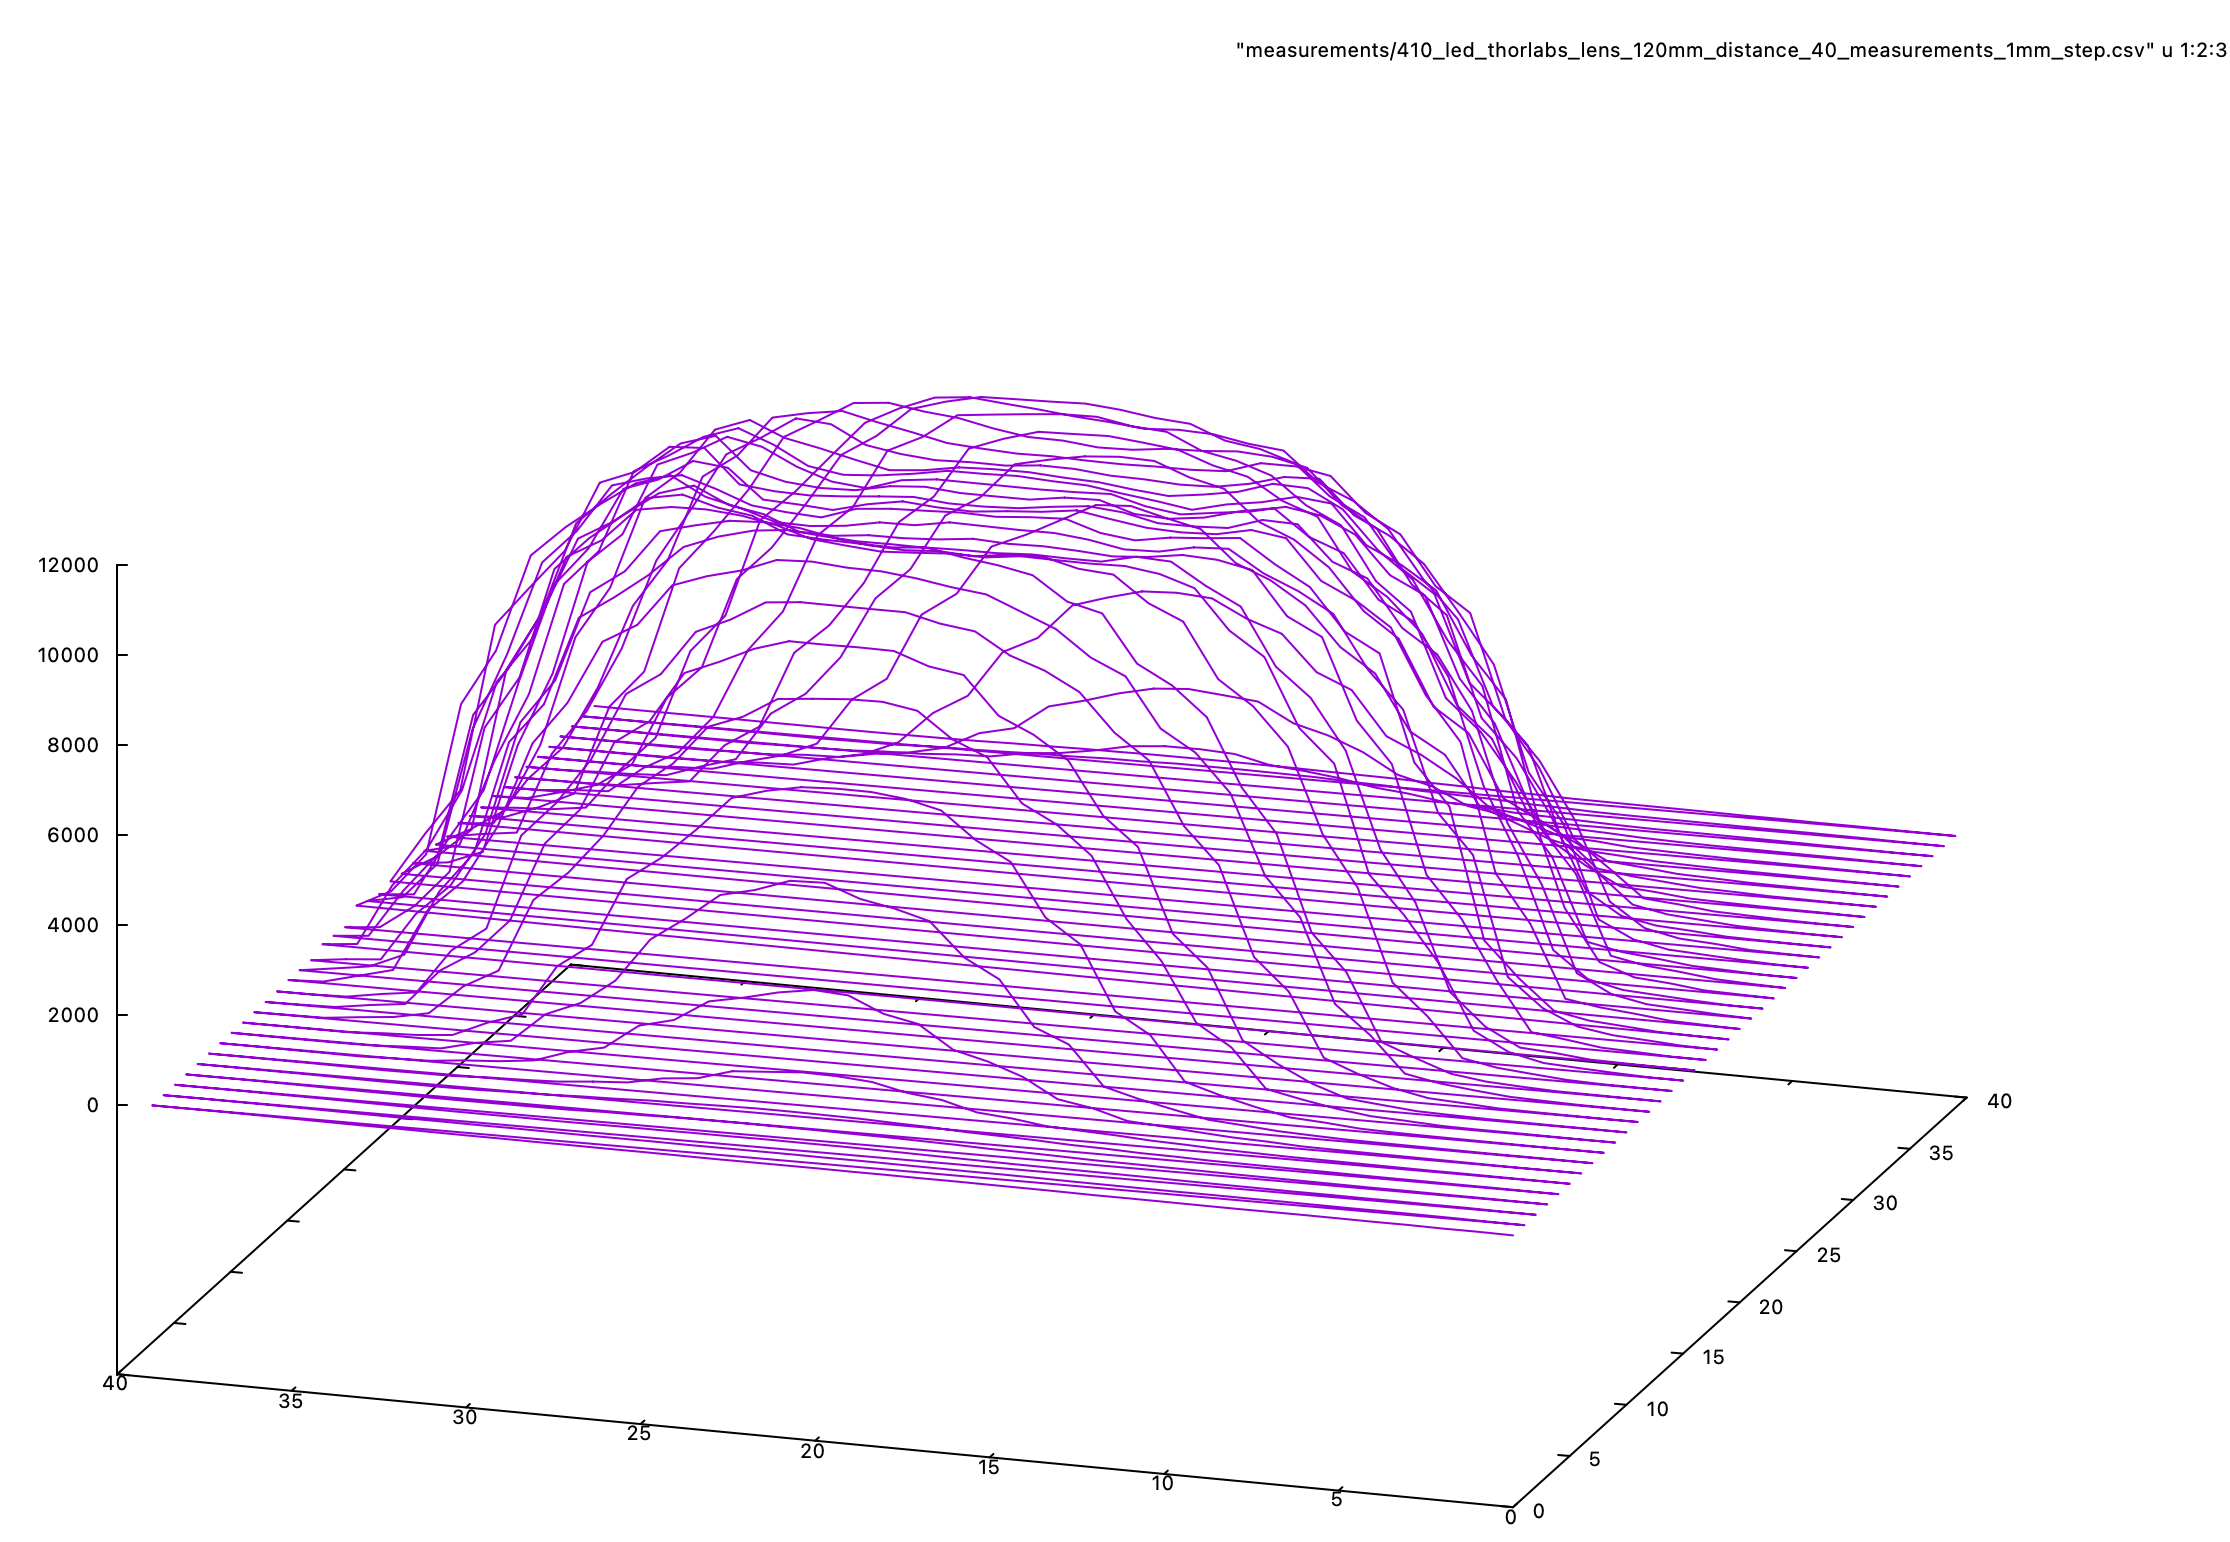 In an earlier test of the Thor lens, the LED die appears visible as a square imprint on the top of the plateau. In this scan, the lens was out of focus.
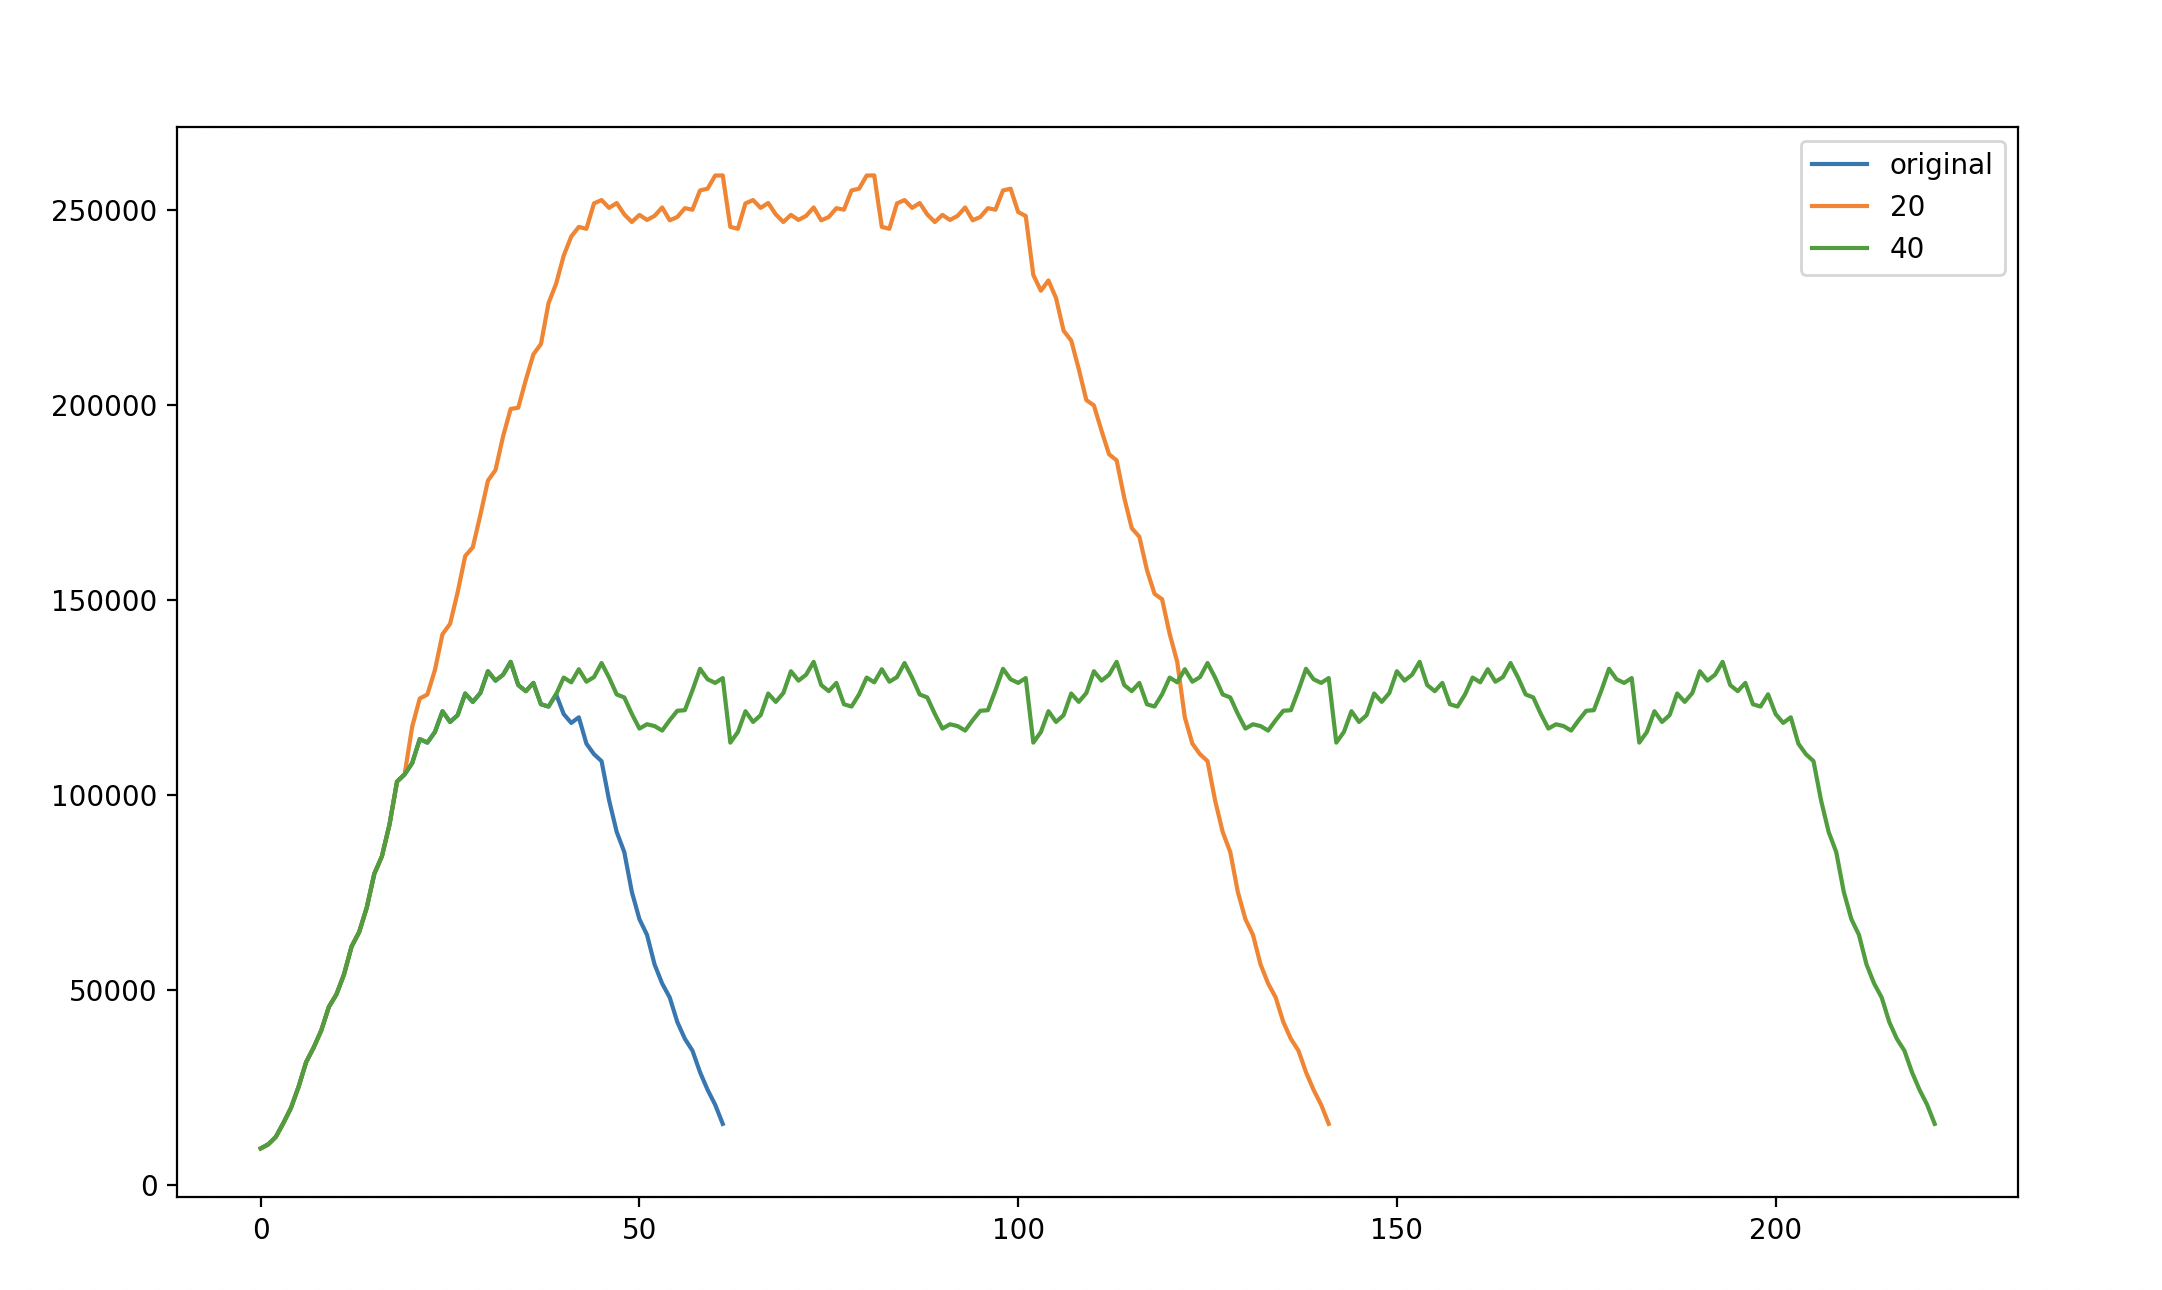 Many lenses can be spaced at half the located spacing, creating a tighter overall plot; as long as the variations don’t line up, the variation is halved with each doubling. If someone wanted to double the exposure power, they could add a second array.
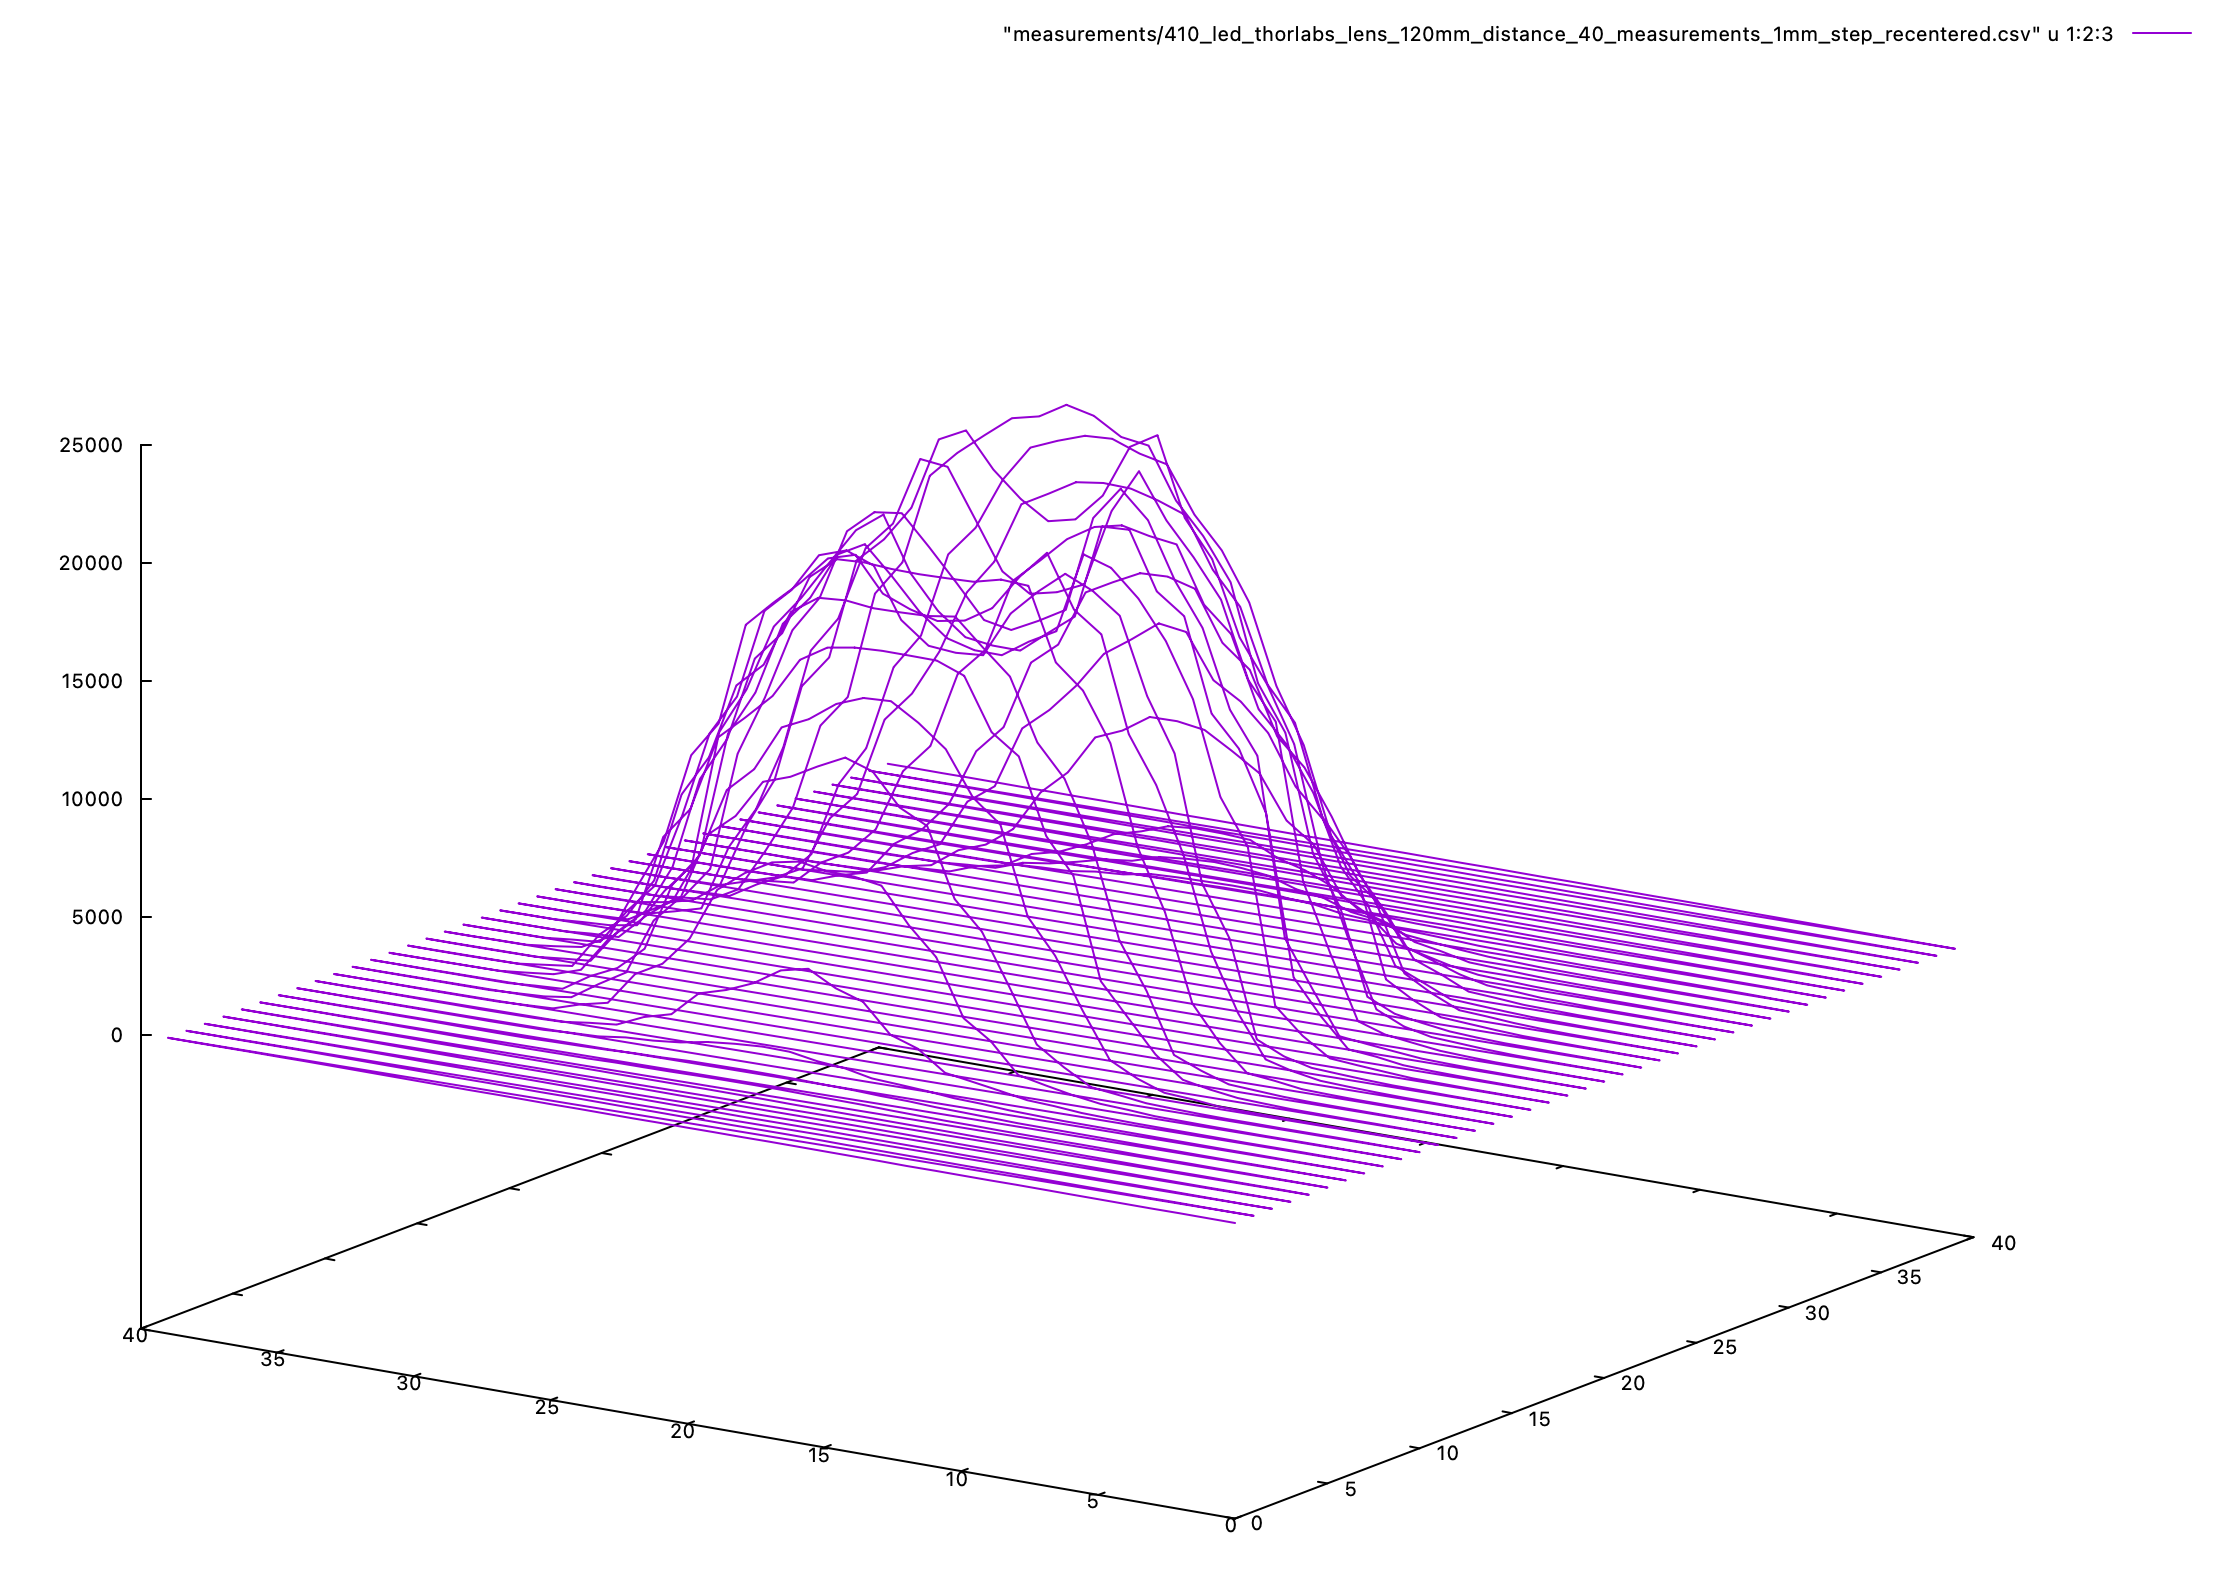 The 3d plot was helpful in identifying issues with alignment, as well as building intuition.
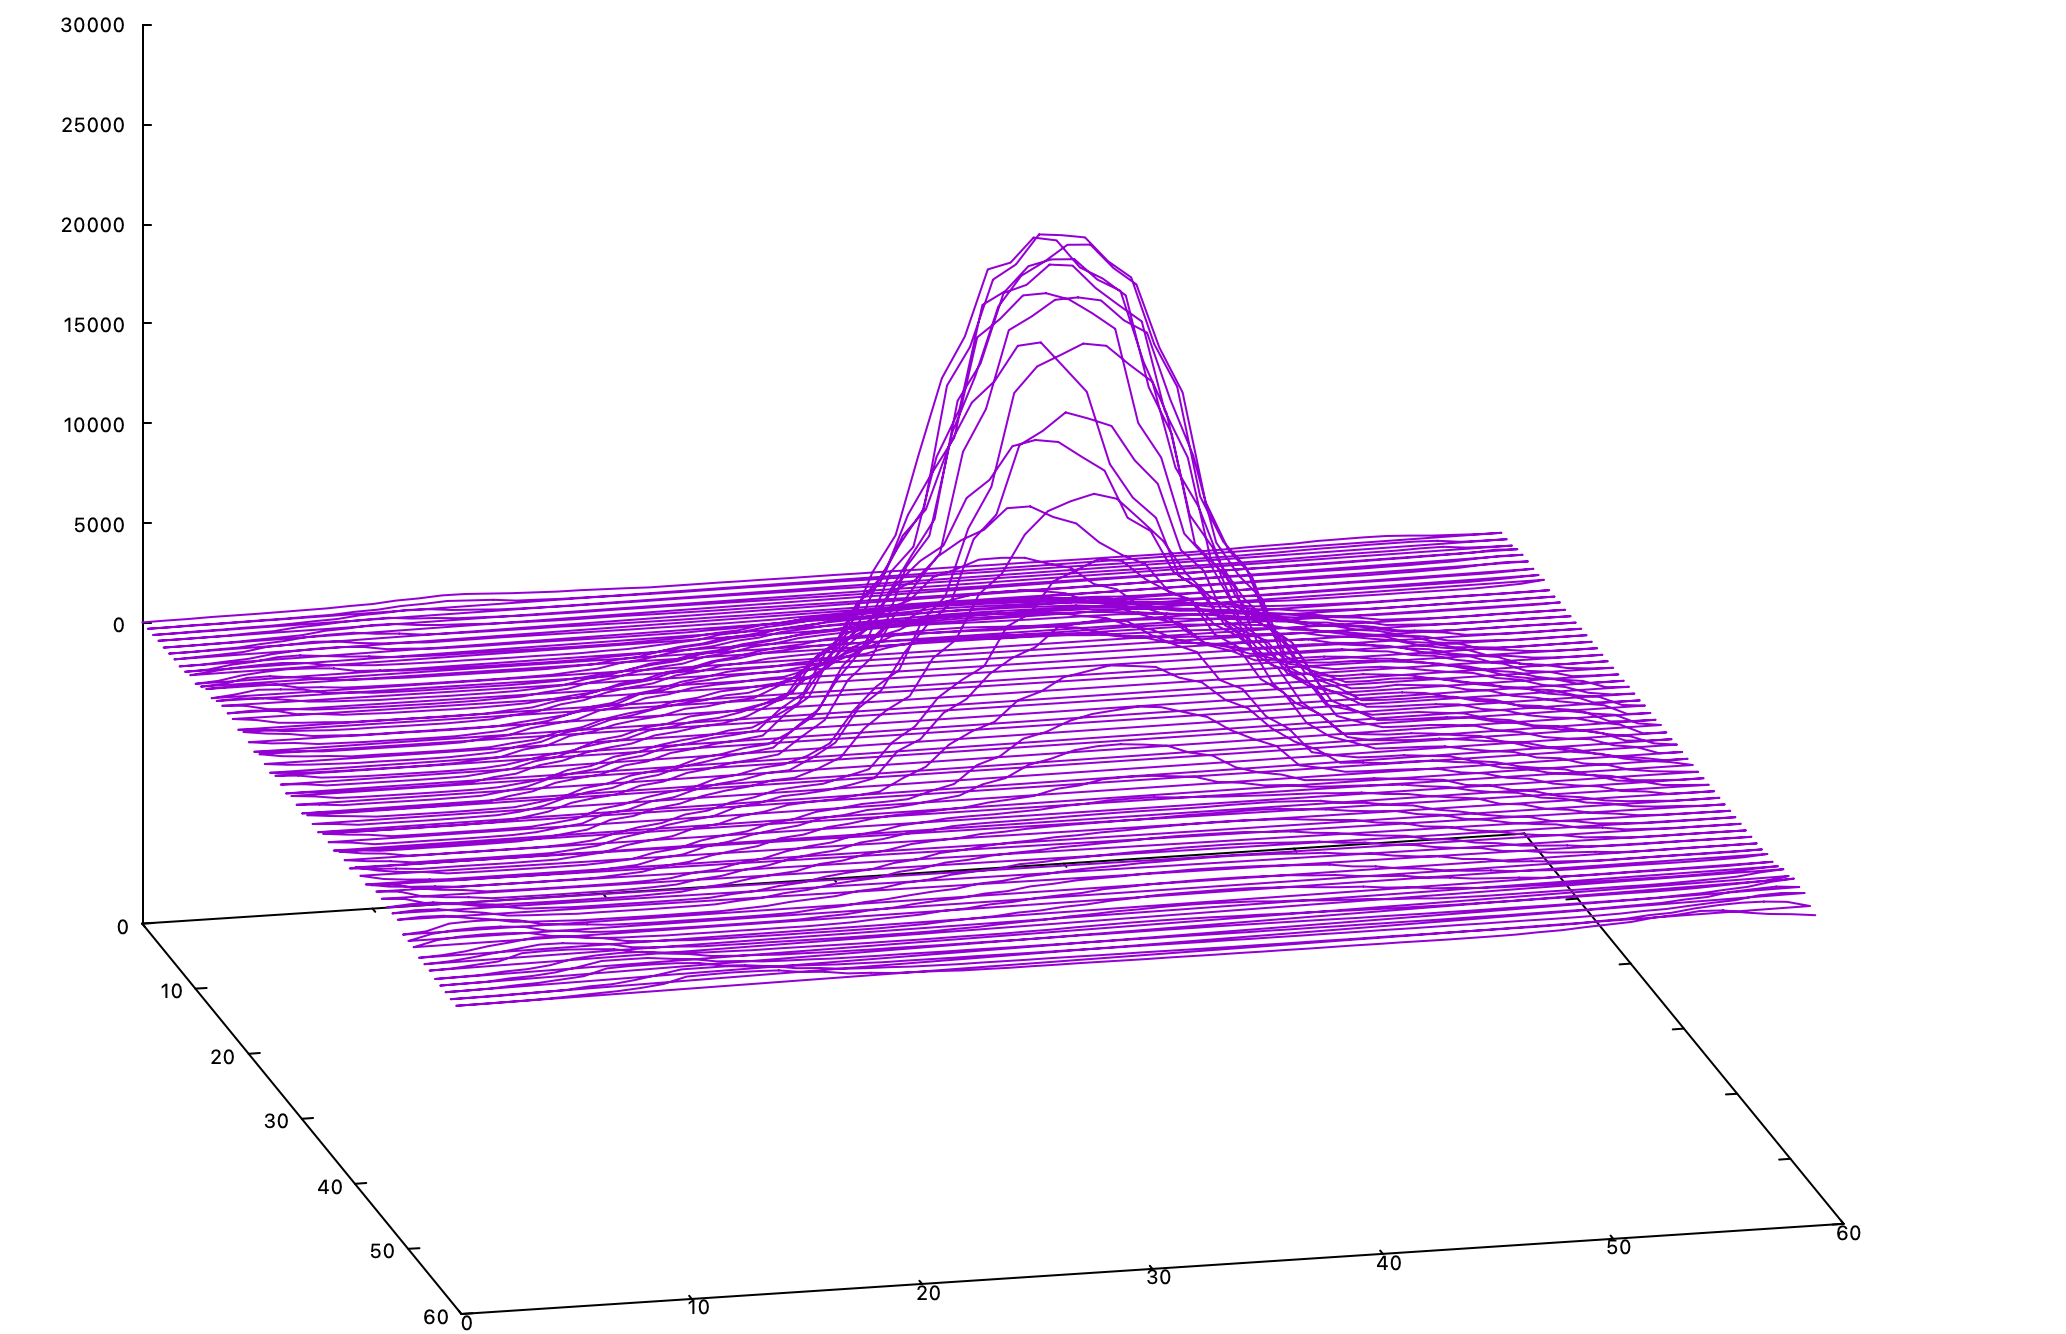 Some of the intuition was around what light levels are significant. Because I had to wear a UV visor with these lights, everything was dimmer. The wide ring, which comes just into view as a ripple along the edges of this 3d plot, had no impact on the side-integration.
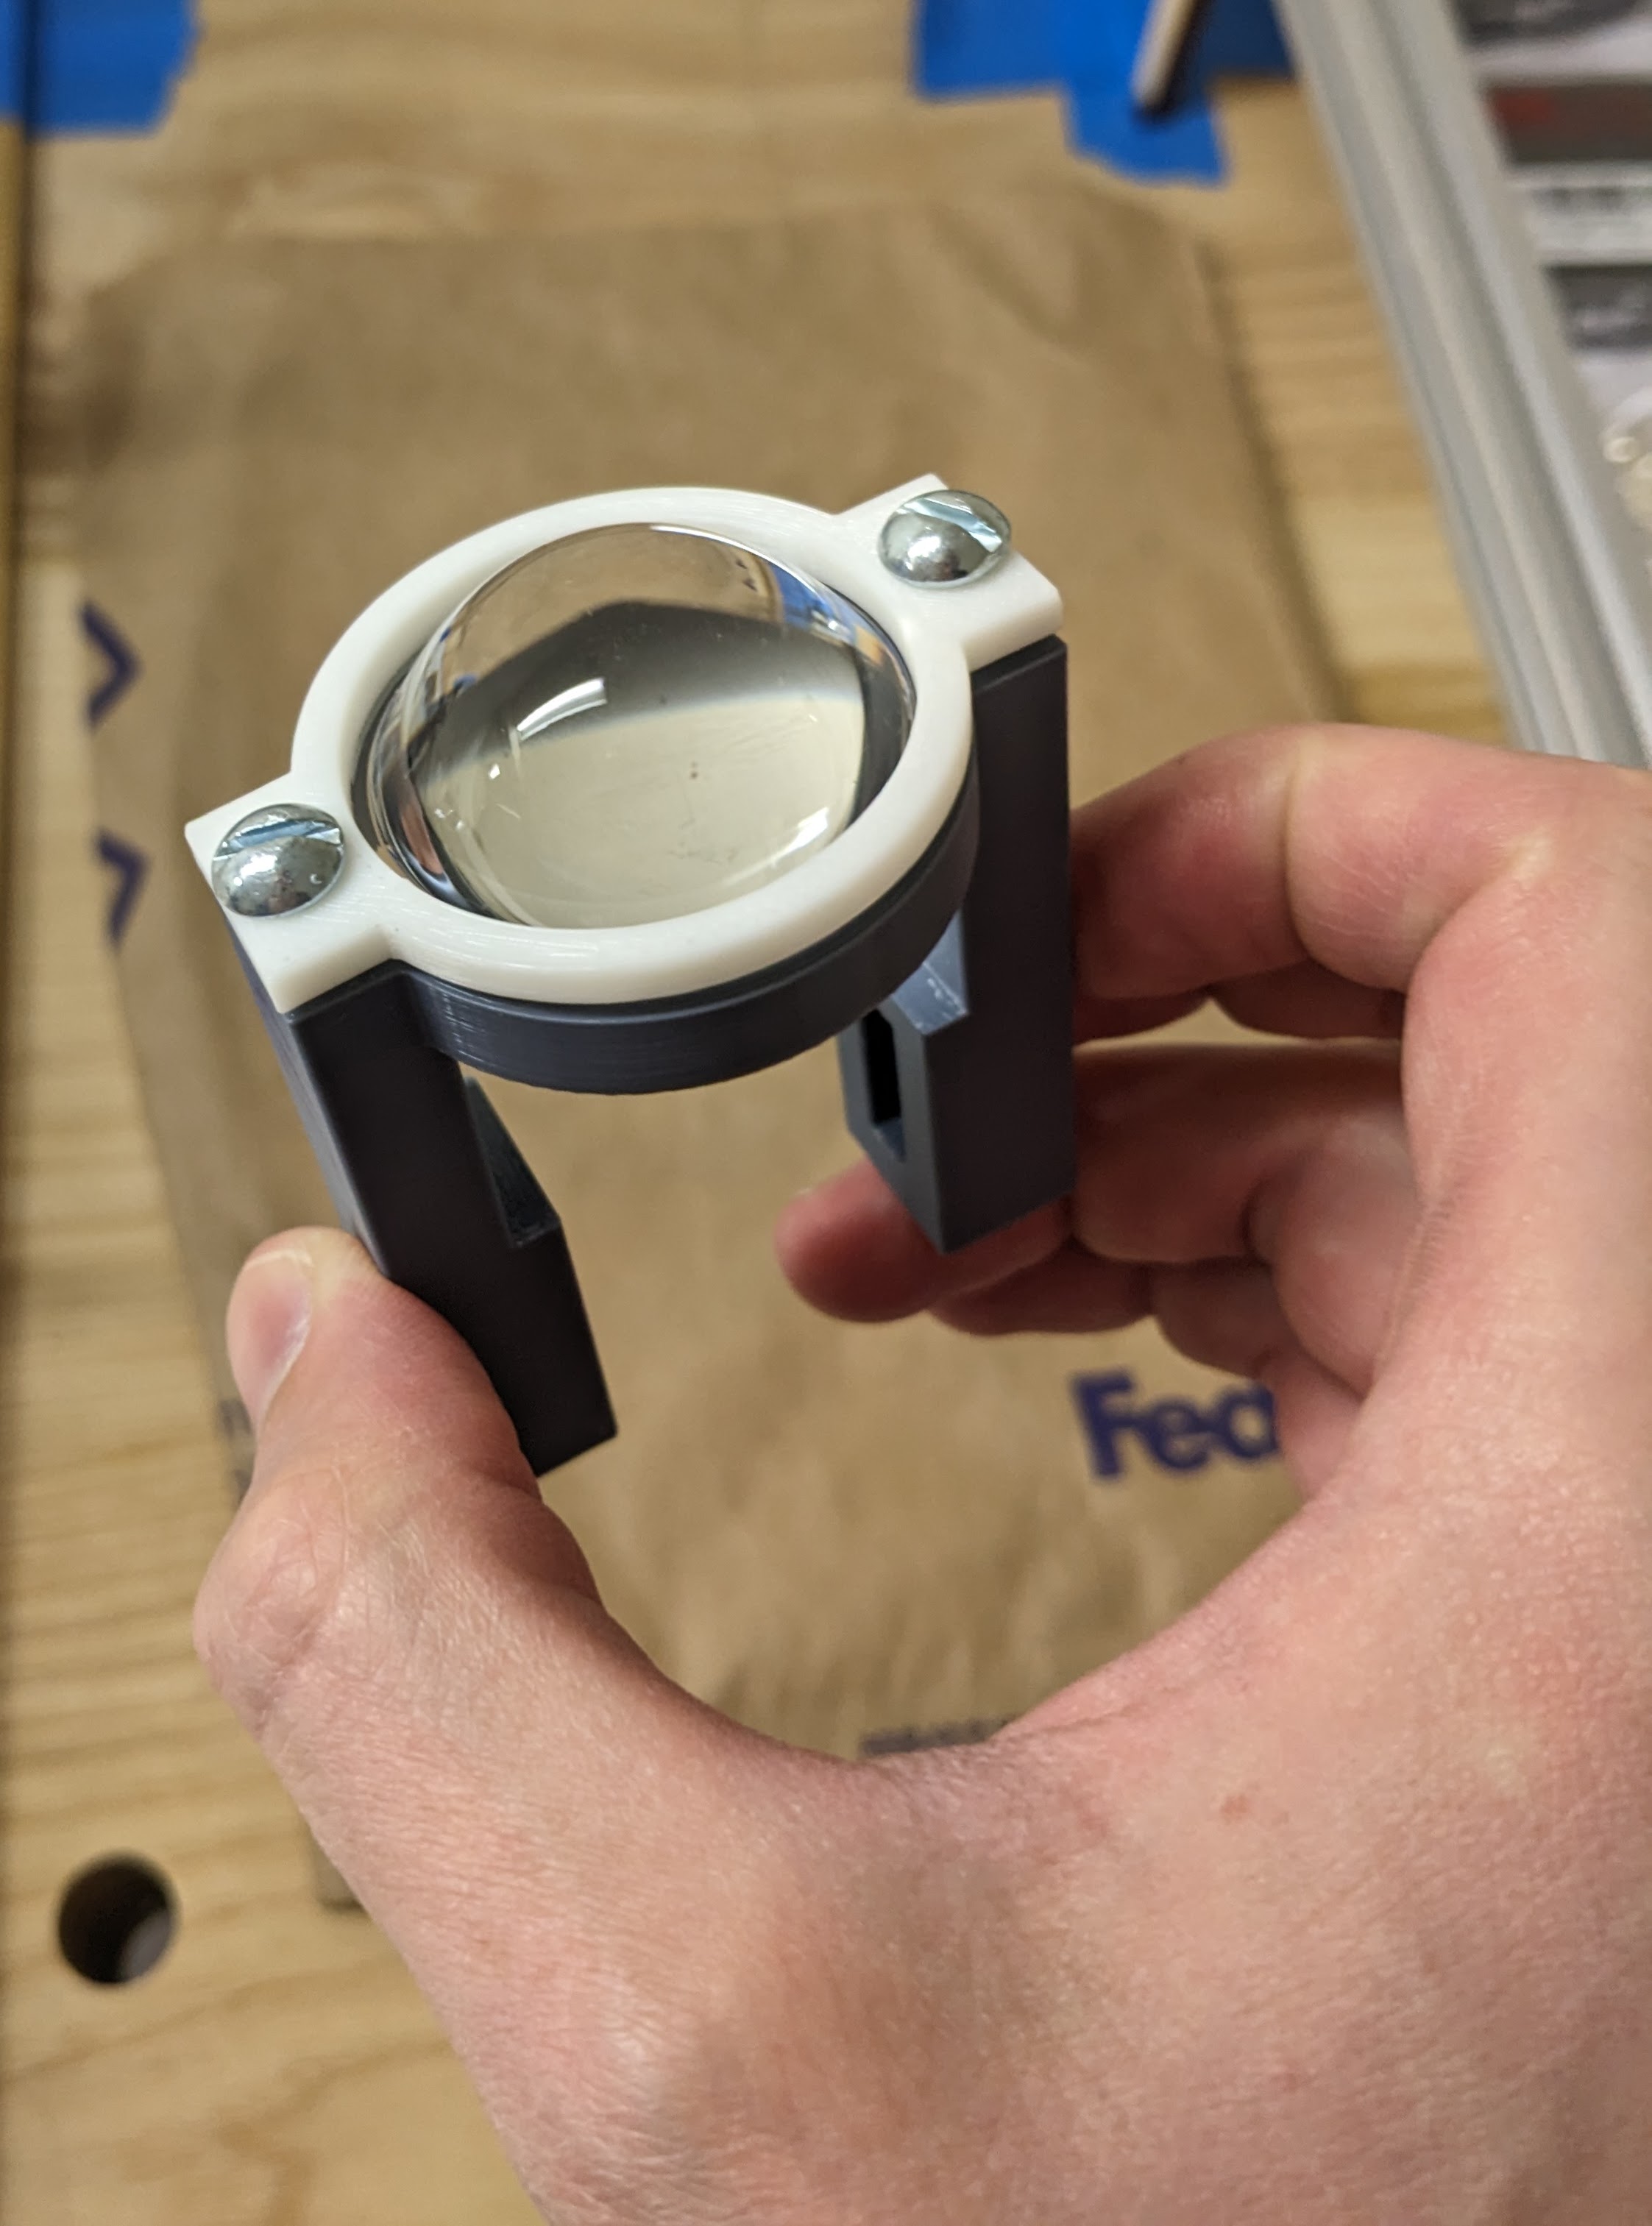 The lenses were sandwiched between a relief in the holder’s base, and a retaining ring bolted into the top. The holder had integrated legs with slots to bolt into 30mm square aluminum extrusion. The lens-holding feature worked well; the leg slots did not, and were finicky and time-consuming to adjust.
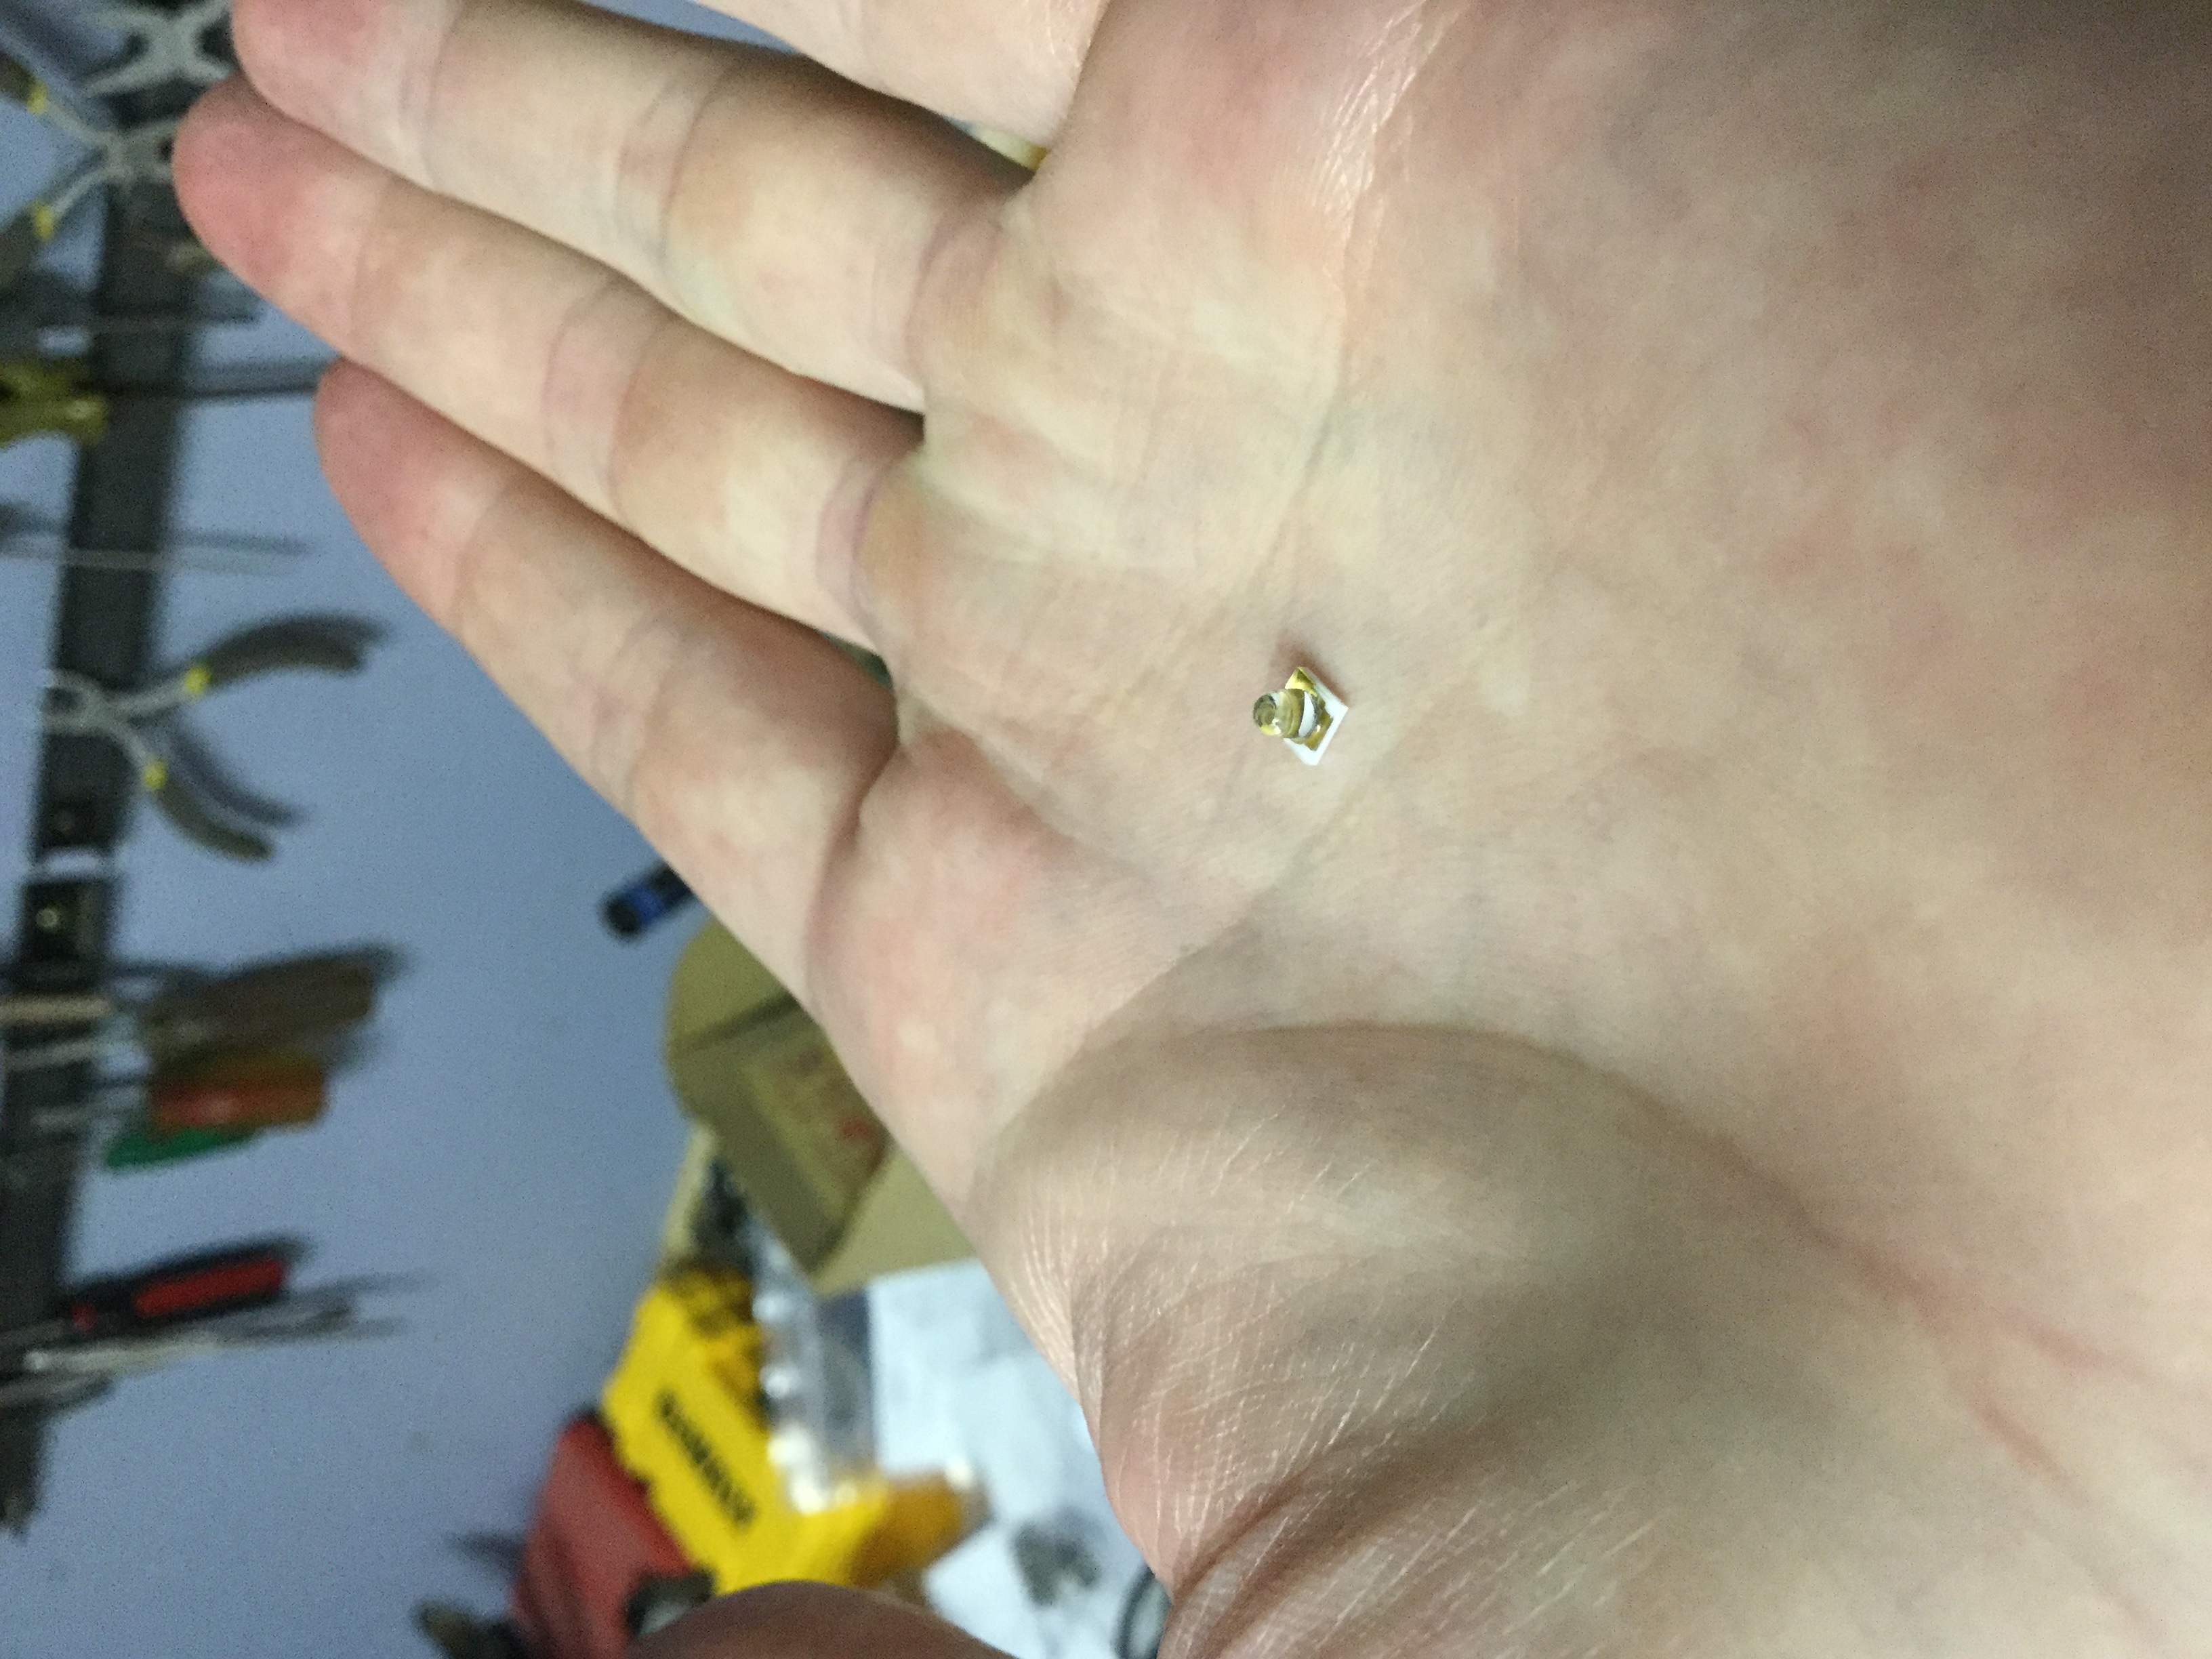
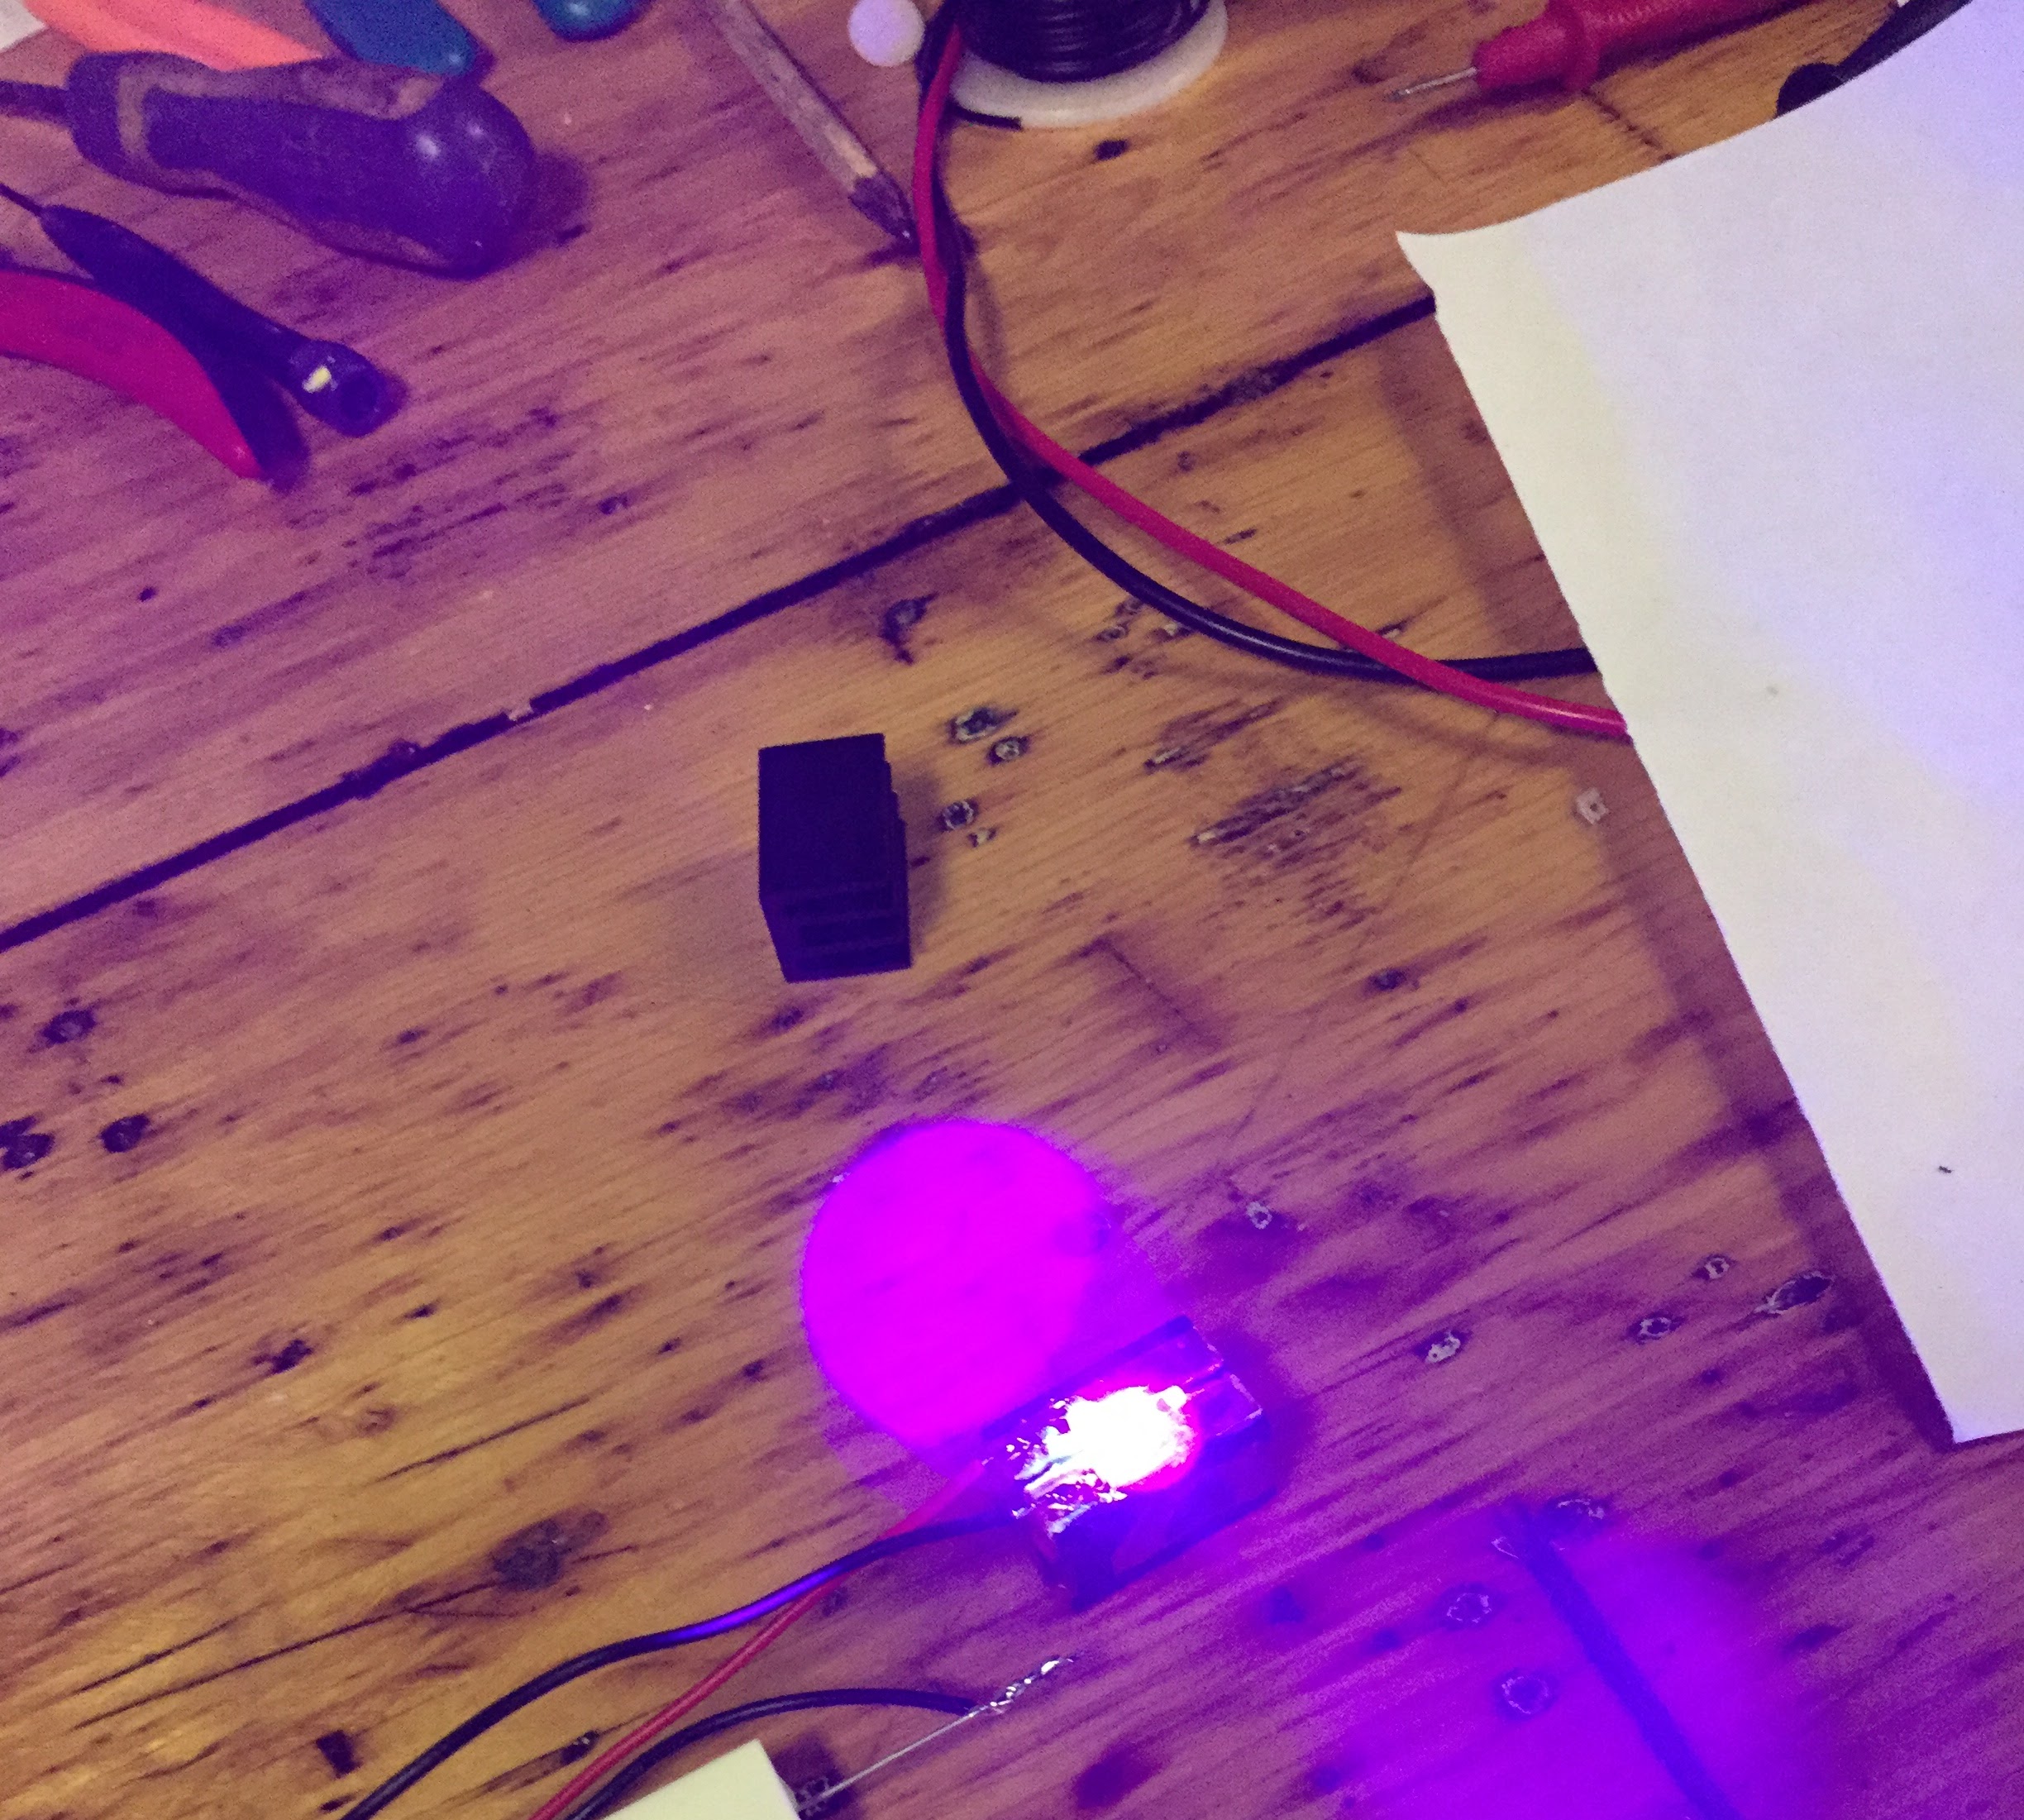
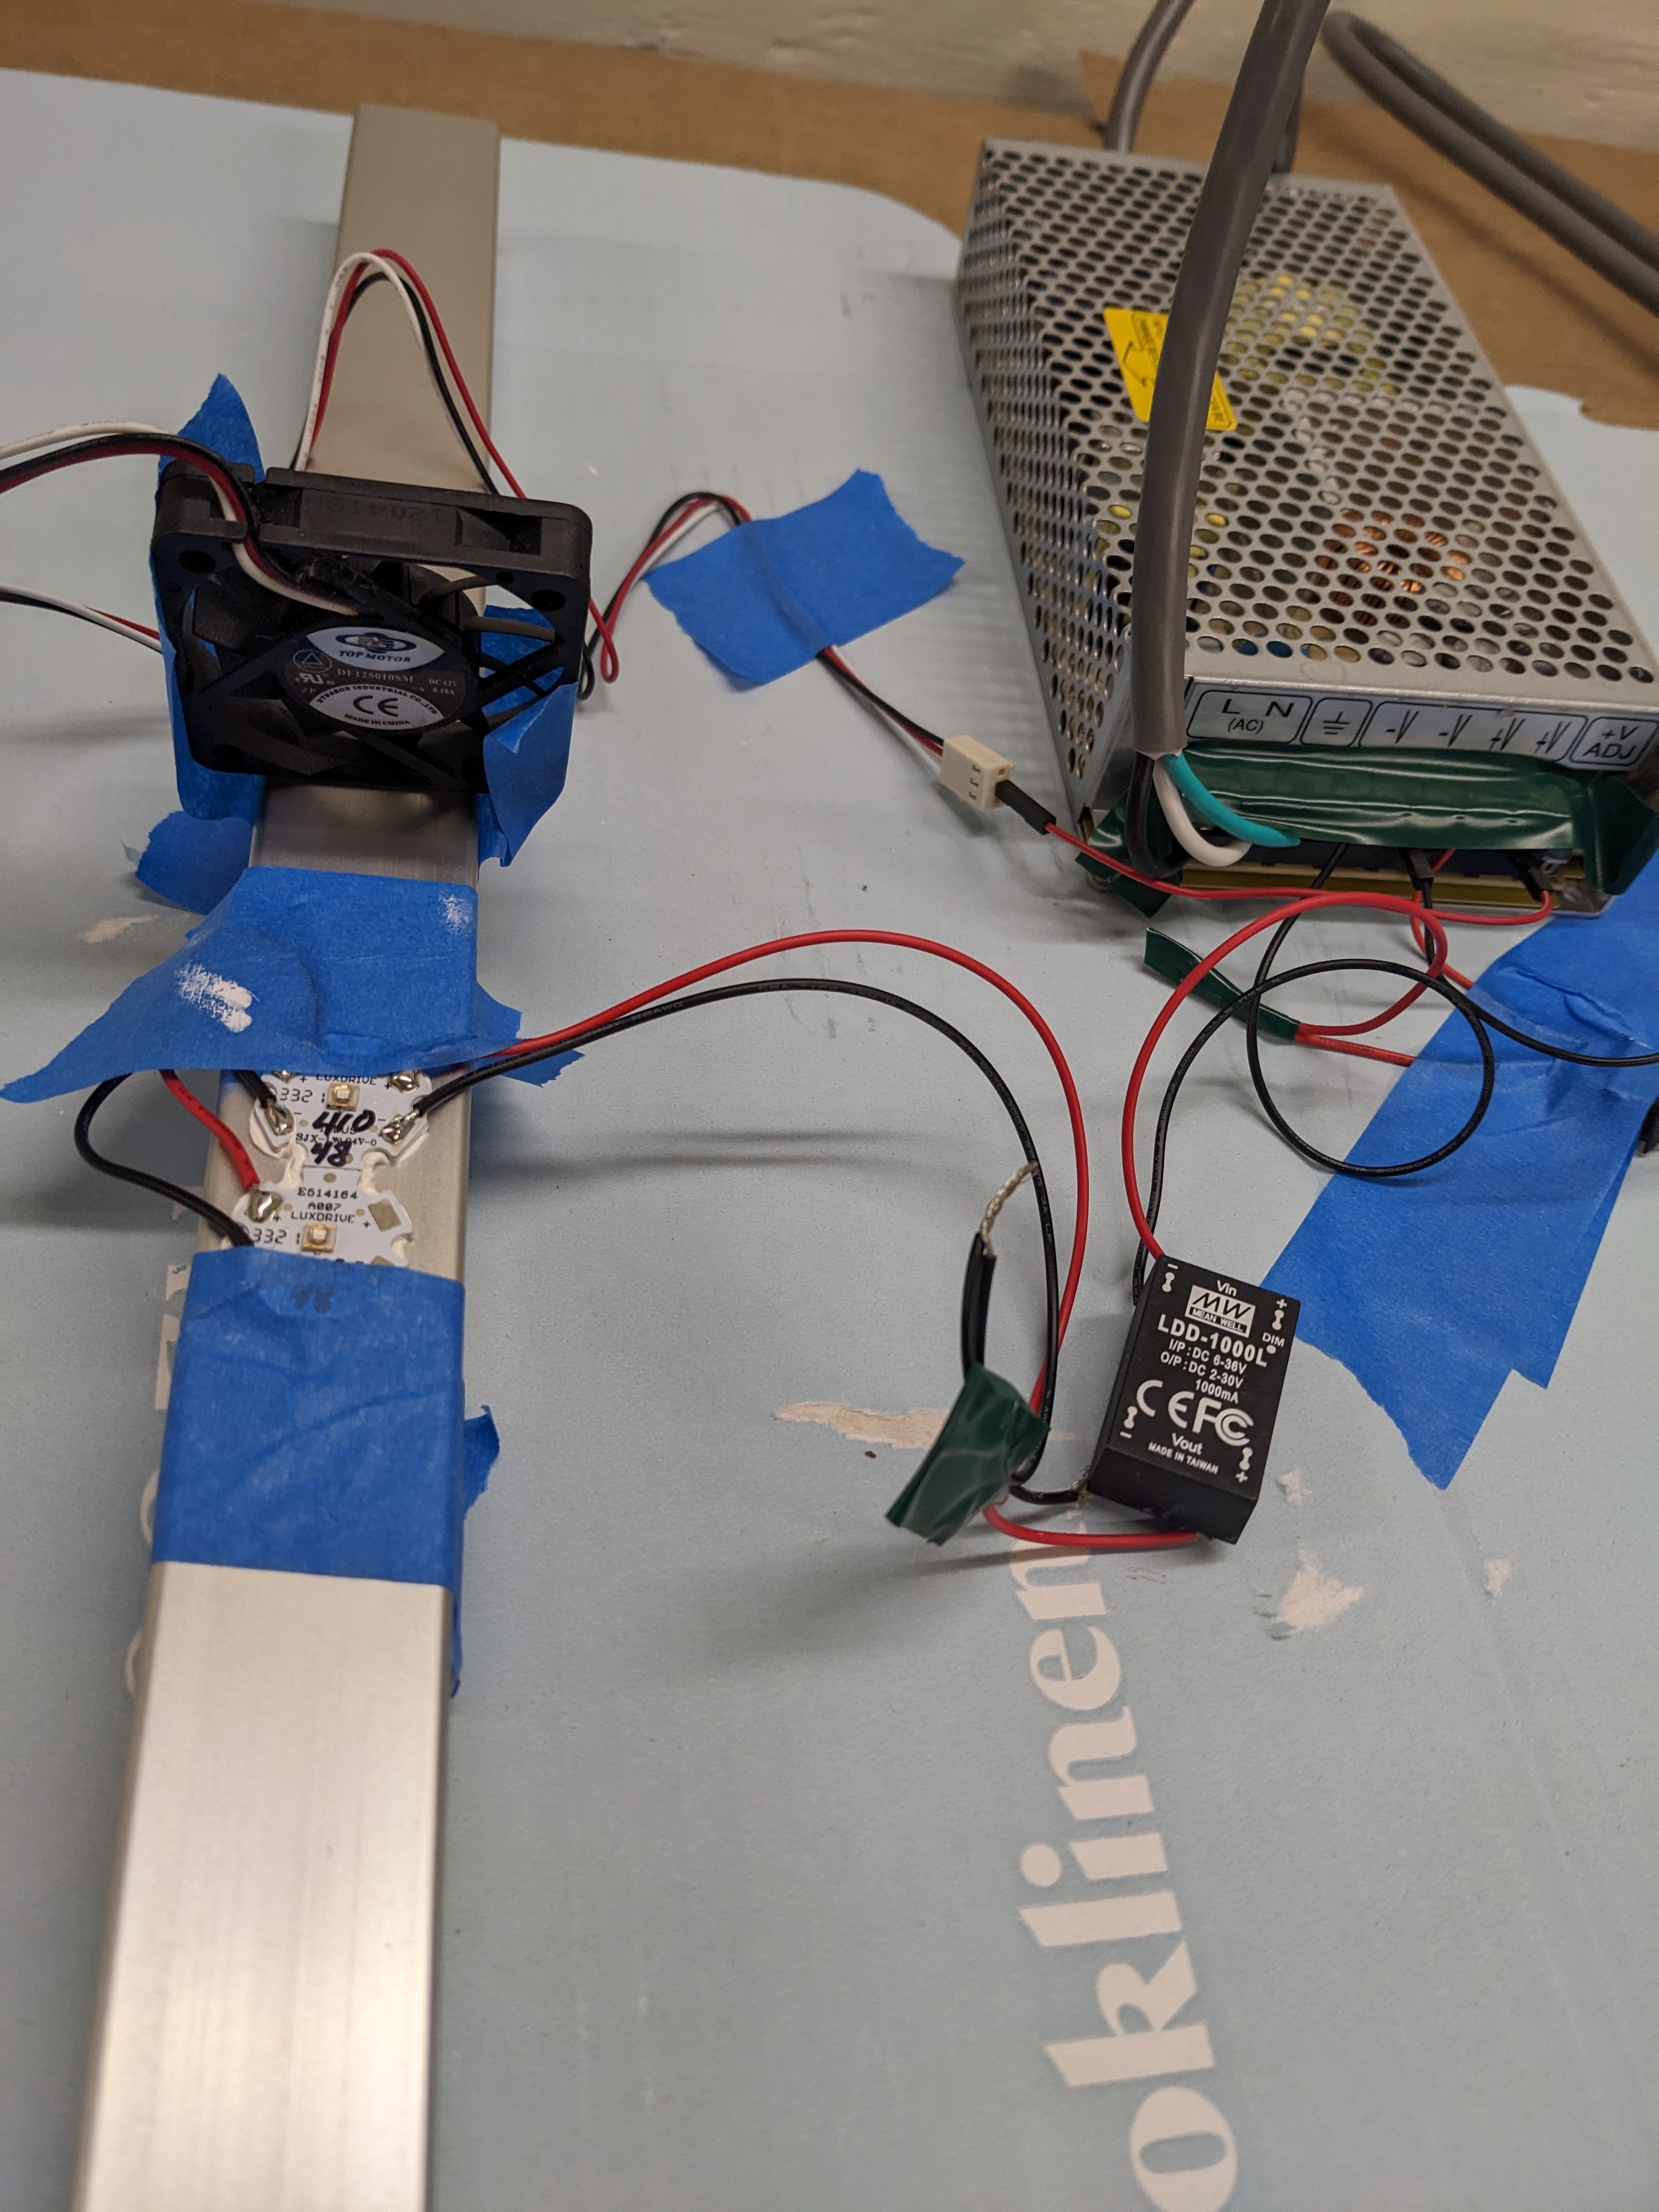 The LEDs during their first test on the boom during set-up. The fan was not needed, but was ready just in case.
Hiccups
This project was not a straight line, and many obstacles arose during the building of the measurement set-up and writing the controls and analysis software. A few still remain.
The first working version of the measurement routine did not automatically drive the sensor along an axis. Instead, I moved the sensor by hand in-between passes, taping it down so that a mark on the sensor board lined up with ruler ticks printed on a paper strip; I marked each one with a pen as the sensor went by. This was time-consuming, and meant that I had to sit with the experiment (while wearing an uncomfortable UV safety visor) and make this adjustment once a minute, for the hour or two that it took to run. Adding the lead screw and automating the entire process made this experiment much faster, and freed up time for other things.
The initial measurement experiments were run at a 3mm pitch. While this worked well for measuring the LED without a lens, the first lensed measurement showed that this step was too wide. Lowering the pitch to 1mm took some new (to me) figuring around stepper motor pulses: the steppers used have 1600 micro-pulses per rotation, with a 20-tooth gear moving the belt. This means 80 pulses per 3mm, leaving an uneven number (26.6 repeated) of pulses for 1mm. Every third 1mm step issues 26 pulses, and the other two issue 27 pulses. This results in only a small variation in placement: 3mm/80 pulses is 0.0375mm per pulse, so 26 is 0.975mm. The first step will be .025mm off; the second step will be 3/80 * (26 + 27), or .0125mm off; every third step will be spot-on. This is excellent for a motor that costs less than $20. The lead screw was chosen with a 1mm pitch to make this straightforward for the sensor axis.
Managing a variety of hardware sizes was a challenge. One quirk of the frame material was that series 5 and 6 aluminum extrusion were mixed. Because of tap availability, some imperial hardware was used as well. All together, m3, m5, m6, m8, and 10-32 bolts were used. This was all a bad idea, and many prototype parts for the movement system had to be remade because of confused bolt sizes, lengths, and bolt-head clearances. Extrusion does not have extra clearance for bolts past each nut, so many bolts were cut or ground short or had washers added under the head. Finally, I forgot to order extrusion nuts, and tried to use regular nuts and washers for some time; this made some adjustments impossible, especially to the lens holders and height-adjustment stilts; eventually I made my own nut adapters.
Alignment of the light and lens holders was a consistent issue. Each mount holds the lens in a ring and lip that are bolted together; this part was excellent. The trouble lies in how they mount on the boom. Each holder can pivot to rotate, move side-to-side along the boom, and slide in/out from the boom (and LED) to adjust the focal length. While they are certainly adjustable, any adjustment is difficult — the smallest movement in any direction can upset the others. A better design would only have adjustments for the focal length, with the centering over the LED and the angle set across experiments.
The aspheric condensers from Thor Labs are excellent — too excellent, it turns out! One alternate function of a condenser lens is in magnifiers and projects: the image shown behind the condenser is flipped and magnified with small changes to focal length. With an LED of this side, the die itself showed up as an image, making for some difficult focusing during setup. Thor sells versions of the same condenser lenses, but with a polished, diffuse surface. These, along with fresnel lenses, are recommended for removing the LED die with a little interference. One lens tested was hand-polished with 600-grit automotive sandpaper, and re-tested — it generated a smoother graph.
The sensor data had some amount of noise of three distinct types: small spikes, spot slumps, and zig-zags.
The spikes first showed up in a fresnel lens test, shortly after I added the second axis. I didn’t think too much of it – fresnel lenses have grated rings, and I thought there could be some periodicity in how the sensor lined up with the rings. But I didn’t look into it further when it kept showing up in other lens tests – I was hoping to get some simulation results out, without putting more effort into the equipment. While the issue didn’t match my theory anymore about what was happening (this is always a good hint…), the data was also good enough to get results. It’s a $2 sensor, after all.
Later I found the cause: while cleaning up the controls code, I noticed that one of the loop indices (the outer one, meant for the sensor axis) was being used to select the compensation for the light axis stepper variation array. The light axis was supposed to take three steps of 26, 27, and 27 pulses repeatedly, to closely approximate 1mm steps; this mistake meant that the first scan would take steps of 26 pulses all the way across, then 27 pulse-steps for the second scan, and so on. The 26-pulse scan would be about 4% (<3mm) shorter than the other two, which meant concentrating more readings in the higher-intensity areas of the light spot – creating small spikes in every third scan. This mistake came from the addition of the second axis, when the one, existing loop that used an index i was pushed outwards to make room for an inner j loop – without updating this index.
I was able to write an interpolation routine that re-sampled the 26-pulse traces at 27-pulses, to even out all the data. (The data is valuable, and takes a long time to gather: for the lenses that worked well in simulation, re-gathering these measurements would take about 5 or 6 hours.) This ended up smoothing the curve well – both the measured data (spikes) and the re-sampled data (no spikes) are shown here:
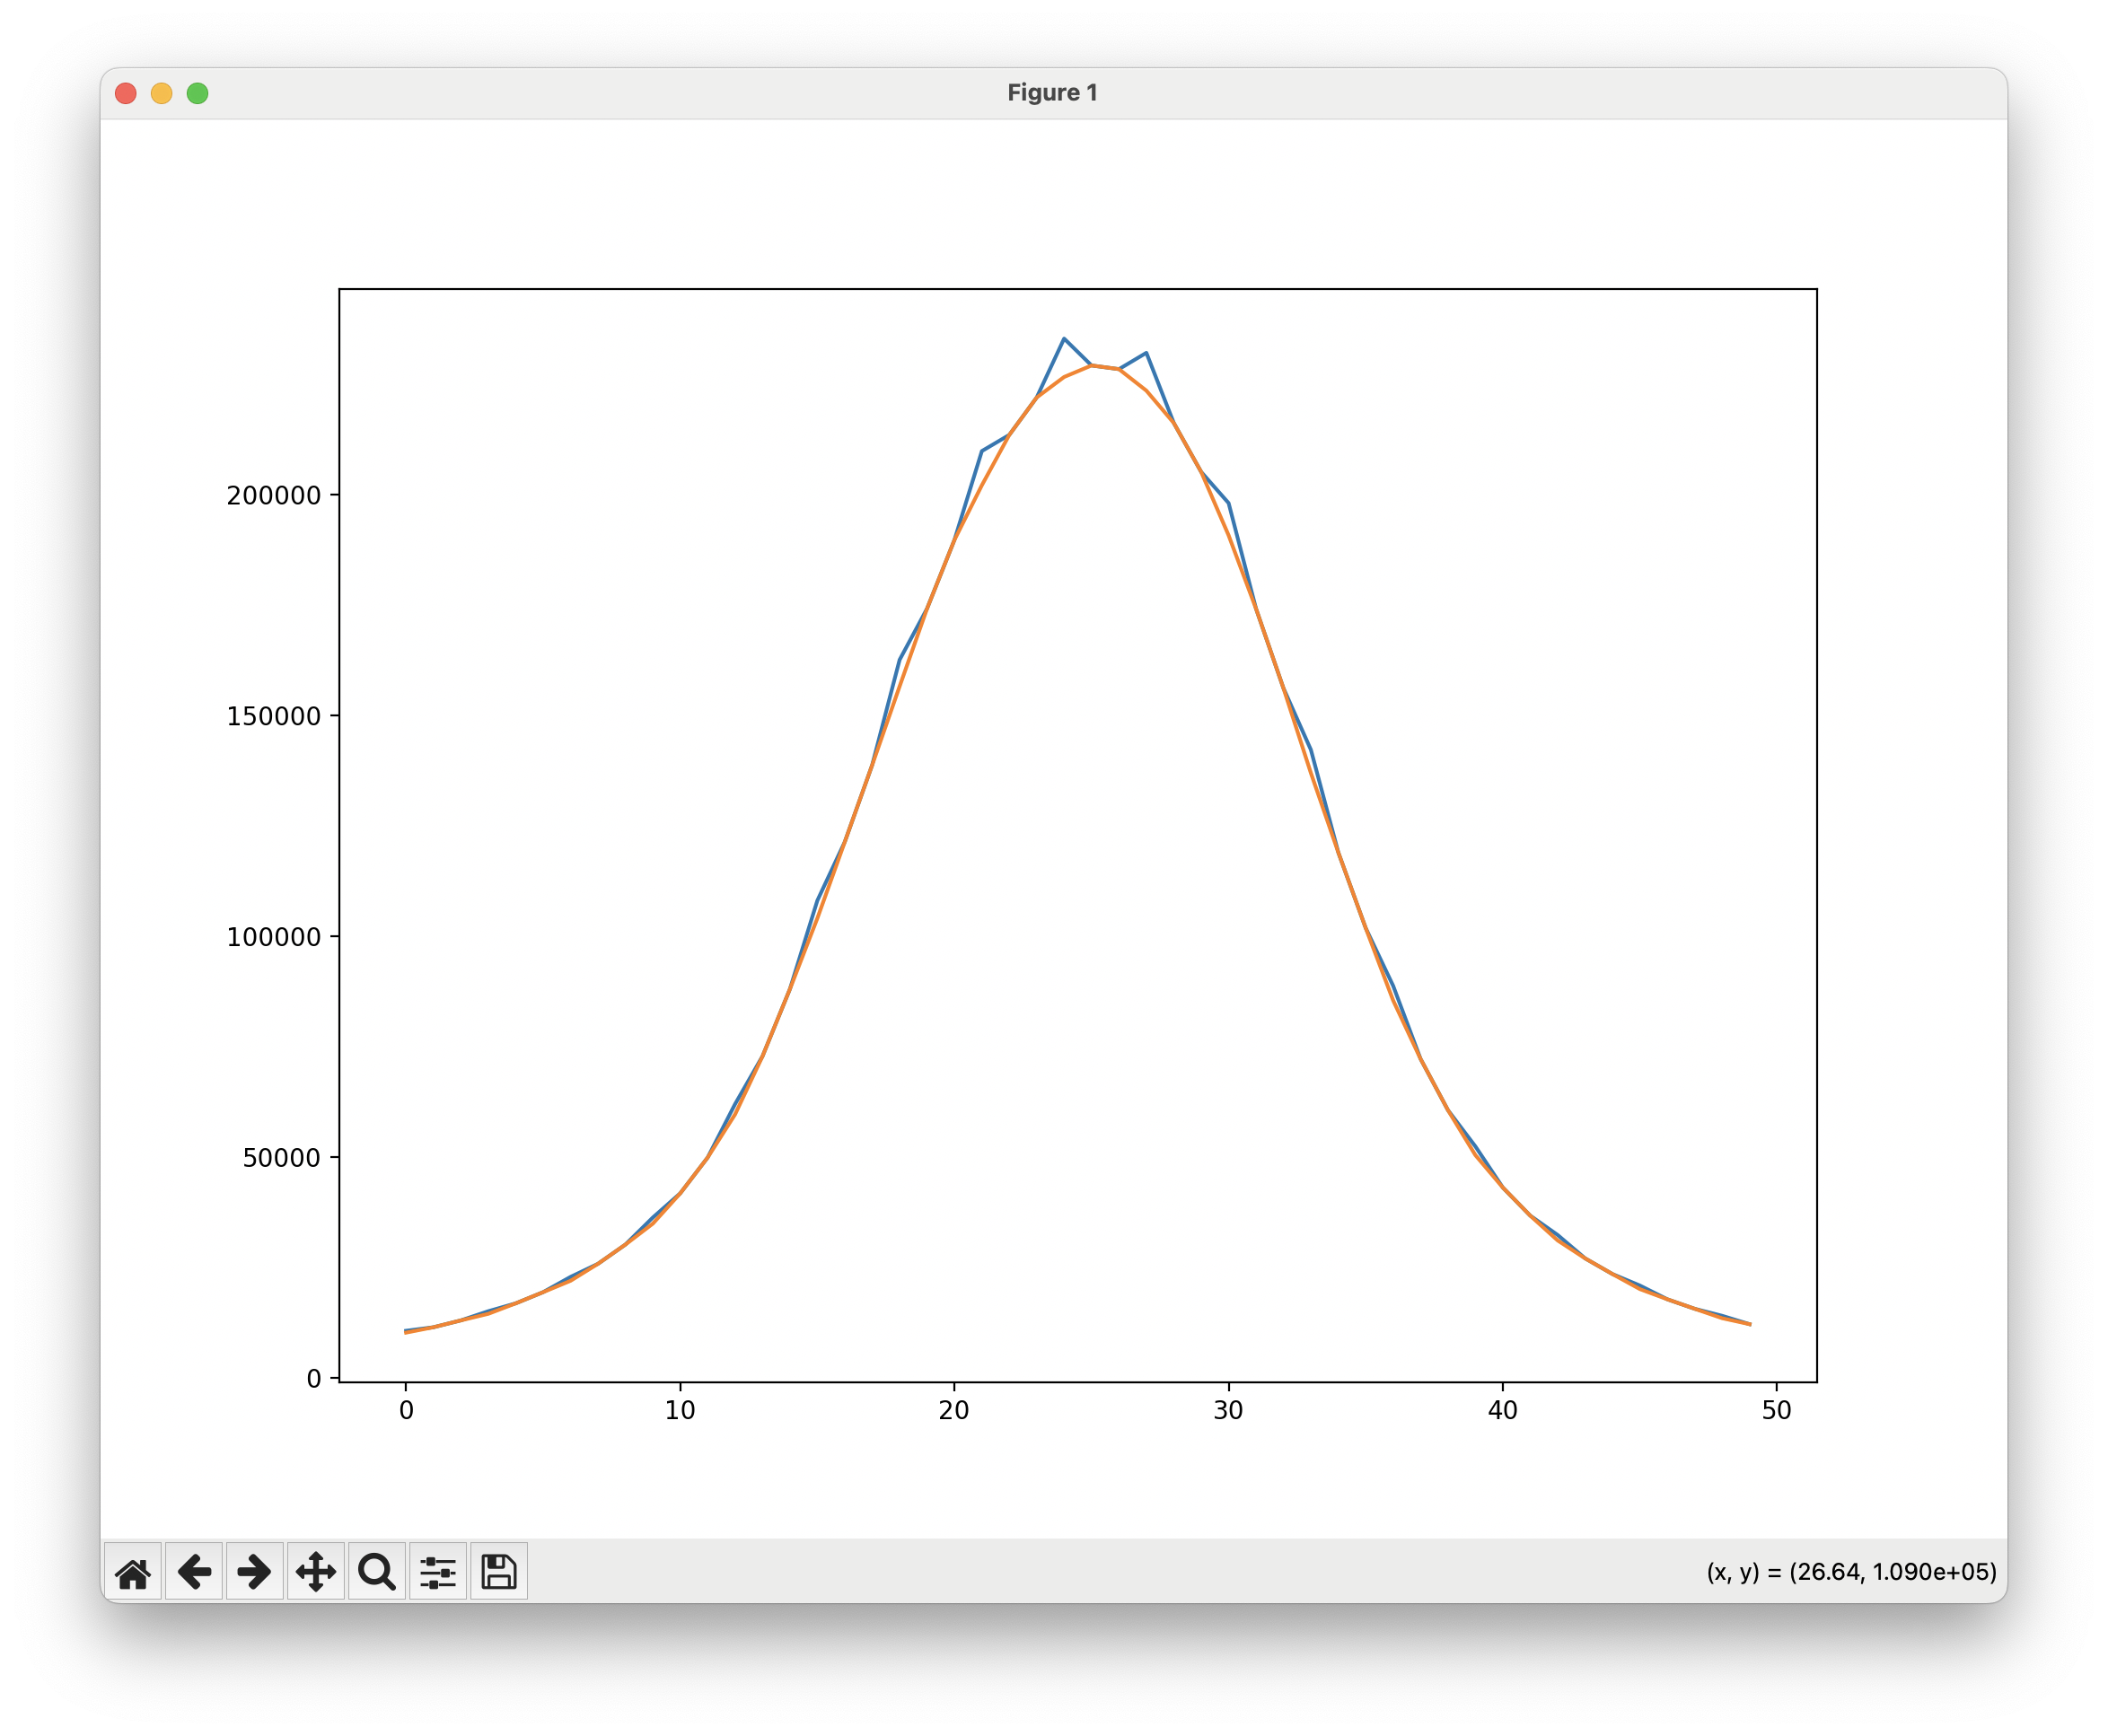
The simulation graph of the combined spots is easier to read, and shows the center and combined peaks clearly.
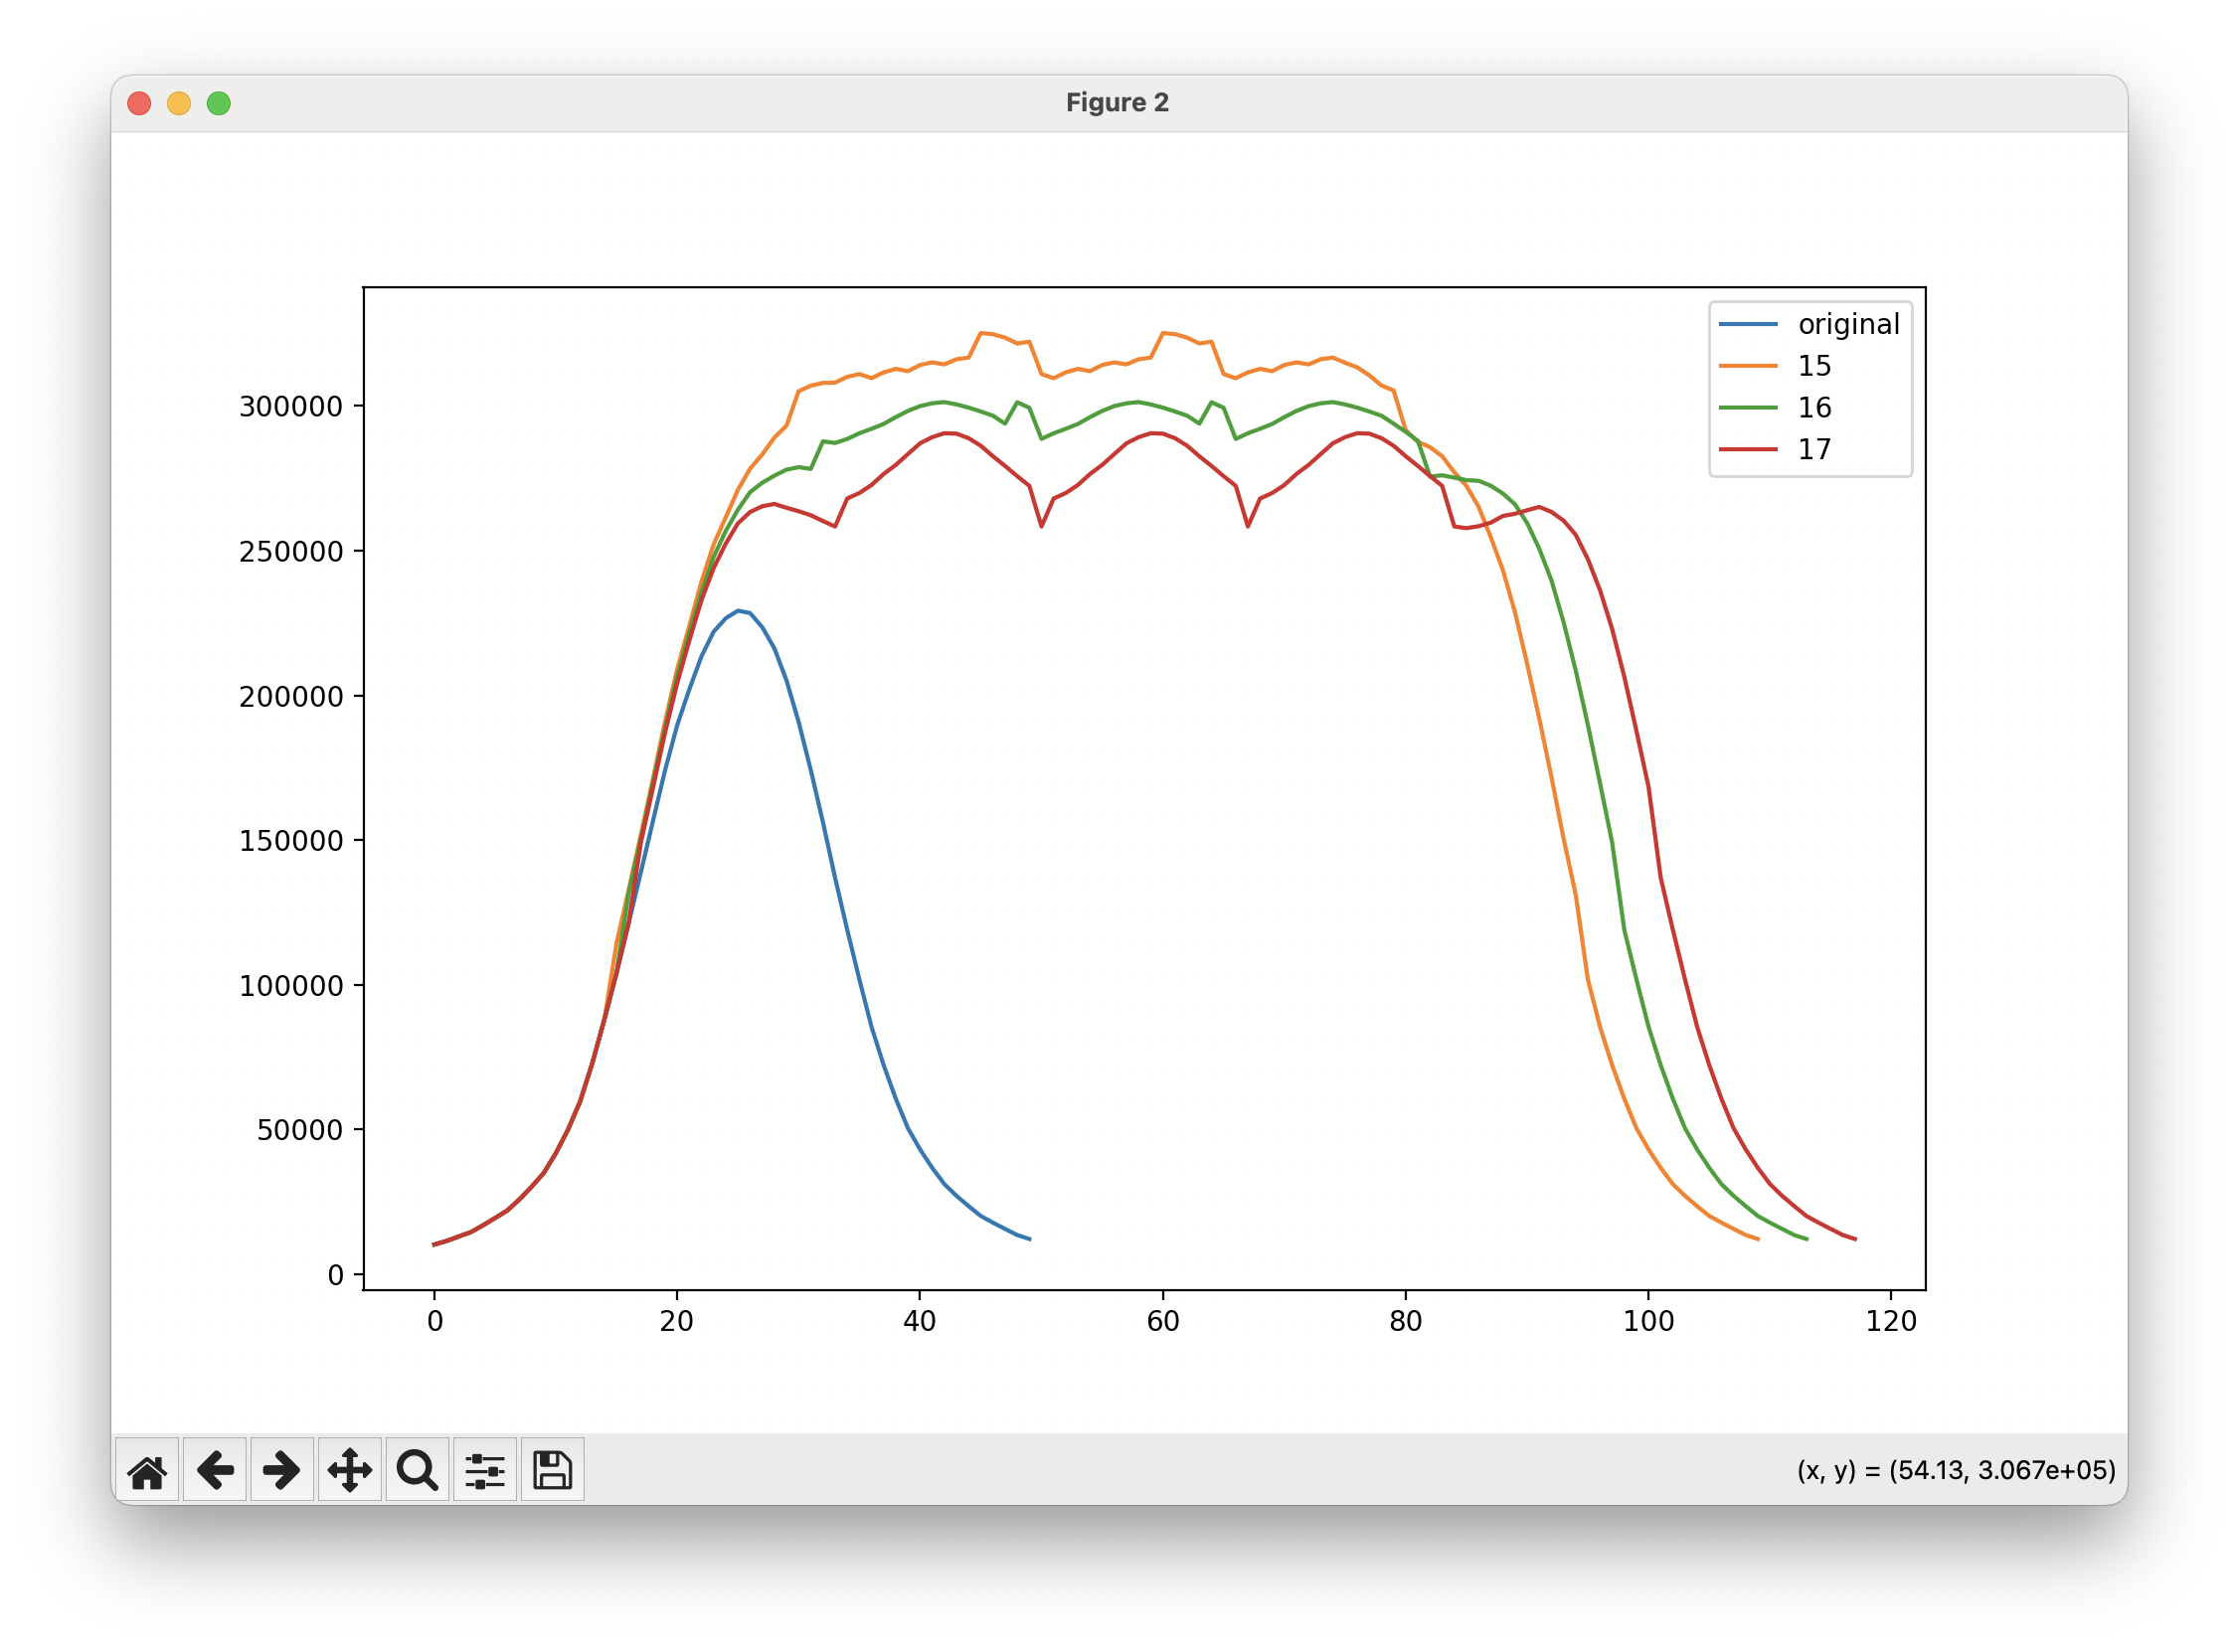
For the Thor condenser lens shown, removing this noise didn’t change the ideal spacing (16mm) – but it did lower the variation, which was at 6.17% with the spikes, and without is at 4.42%. (Coincidentally, this step-shortening does continue to validate the sensitivity and error rate of the sensor; each step in the 26-trace was only .0375mm shorter than the 27s.)
The slumps in the 3D-views of the light spot always sloshed the light towards the back of the light spot, with later measurements having a steeper descent than the early ones. This asymmetry was always in the boom’s movement axis. While a tilt in this axis doesn’t change the cumulative intensities of how a collimating lens, it was still troubling. I thought the sensor was being pulled and tilted by the i2c and power wires, which have some residual coil that was able to pull a light sensor board askew. I tried mounted the sensor on brass plate heavy enough to hold it flat. This slump didn’t go away. One theory was that the sensor had some inertia after hitting the peak, and took a few seconds to cool down, creating this steep descent. I had looked at the boom axis, and tried to bolt it down parallel with the table. A later, improved method of checking parallel-ness (to the table, not to the extrusion frame) showed that this was the source of the slump.
The zig-zags in light intensities showing up above an intensity threshold (4k or 5k); this made the ascent and descent of some plots asymmetrical, and sometimes adds small spikes to the sideways integration. One initial theory was that the belt drive, which was quite loose at the time, was moving the boom with a big step/little step sequence — a sudden jerk from the stepper might send the boom further than intended in the first big step, and the next movement might gradually retension the belt to move a little step. This might have caused the zig-zag pattern in some of the measurement tracks. I had compared the movements of the boom against a ruler during development, and did not see this issue. Nevertheless, I tried tightening the belt (I needed a stronger motor mount to do this), and added a ramp-up, ramp-down, and anti-vibration pattern to the stepper’s travel and timing code. This did not work, and the data remained noisy.
A second theory involved sensor refresh time and inertia: it may take a while for the sensor to acclimate to small changes in high-intensity settings. (The datasheet says this time is negligible.) I tried adding an extra, throwaway measurement before the actual measurement; things improved slightly. Adding an average over three or four measurements made the curve much smoother. This suggests adding wait-time, averaging readings, or using a higher-quality sensor will produce cleaner data. For an experiment with this many measurements, adding time to the measurement step is unsustainable; a typical measurement with these extra readings would run for 4 or 5 hours. Aside from using a better sensor, one solution might be taking slower, higher quality measurements of the centerline; this extra sampling time is possible if only 50 or 60 measurements are needed. This centerline can become a rotational projection to estimate the light shape; most plots were uniform around their center. With this reduction in experiment length, other techniques, like moving the sensor out of the light spot in-between readings, also become feasible.
A third, untested theory is that some reflection makes its way from the table, back up to the boom, and then again into the sensor. The circuit board the sensor is mounted on has some reflective parts, and the boom’s aluminum surface and lens holder bolts are excellent candidates for reflectivity. A paper mask around the sensor, painted with light-absoribing black paint (Black 3.0, from Stuart Semple), may prevent this reflection.
Future work
There are many ways to continue with this project! Actual exposure experiments to validate this approach are a future step (this was not possible for this leg of the project; because of hazards from the lights used, experiments need solo-access to a darkroom for long stretches). Designing mask shapes specific to each lens may allow lens shapes that didn’t work as-is to successfully combine as a strip, and lower overall variation for those that already do. This work needs to be complemented by some work to improve measurement quality: alternative measurement techniques (measuring the centerline only) can produce higher-quality data; better sensors can produce more accurate readings; and more sophisticated data analysis techniques can de-noise the data for lower-variation analysis.
Confirm spacing values and scanning portability with real-world exposure tests
These simulation results are based on measurements taken by a high-quality UV sensor (under 1% resolution), and a positioning system with excellent placement characteristics (under 3% variation). While the 3D visualization plots are helpful in validating the experimental set-up, a real-world exposure test will confirm that spacings can be simulated like this.
Similarly, conversions that take scanning speeds from successful exposures and predict scanning speeds for measured lenses should be validated in an experiment.
Investigate Reciprocity Failure
Photographic emulsion does not always have a linear exposure response to light intensity.
When photographic media reaches an exposure level E at some intensity * time, ideal reciprocity means that the same exposure level E can be achieved at half this intensity and twice the time. Or one-third the intensity and three times the time.
Reciprocity failure means that this property is not true! Photographic media has a response that is linear for much of its exposure profile, but elonges for low-intensity exposures; these low-intensity exposures need more time than expected to reach an exposure level. There is a commonly used calculation for adjusting exposure times under a certain intensity threshold.
In the context of emulsion and the scanning strip, some areas of the light spot may count differently towards an exposure than the UV sensor detects. The reciprocity failure correction calculation needs to be derived experimentally, and applied to the light shape to correct this.
Test more lenses
There are several lenses that may be suitable, but haven’t been tested yet. Issues around the LED projecting with condenser lenses emerged late in the project, and diffused-surface lenses are a recent discovery.
Collimation grading
Many lenses tested here tightly collimate or focus the output light, and have excellent light levels across the strip. But the costs vary significantly, with the cheapest lens costing $2.96 for a 25mm spacing ($0.12 per mm) and the most expensive costing $20 for a 16mm spacing ($1.25 per mm). This 10-fold difference in price may not matter in any screen printing scenario, but it’s hard to know. Developing and evaluating a collimation test to grade lenses would help inform these lens choices. Some lenses from Thor Labs come with a diffuser, and are available in two grits; this would help select the better one.
One test is a visual inspection of fine details on a photo-stencil against a vellum screen; as the stencil is pulled away, the distance where details disappear from the screen shows how angled the light is. More angled light will fill the space between the stencil and the screen faster.
Another test is a real-world exposure test of increasingly small details; exposure of smaller details, up to the limit of the screen mesh itself, show that exposure light is not bridging or undercutting the stencil.
Another test idea places a series of tubes over the sensor chip; each tube has a different height and cut-off angle, and the distribution of intensity readings across these heights shows how much light is coming from each angular bin. The construction of these filters needs to carefully and consistently align the tube centers. Some light-blocking paint is needed inside the tube walls, to minimize reflection into the sensor. This test would reuse the same setup, and could move the sensor to take readings in different areas to check for consistency. This test would not work with non-collimating lenses, like the Carclo 10108, because the spot is angled by design.
Mask shape search algorithm
A possible avenue of future work is exploring mask shapes to counter sources of unevenness in each lens and spacing. A mask would mount over the lens and selectively block areas of light, to lower variation over combined lenses. This may allow these fresnel lenses to work well in a strip.
While many of the spacings located already have minimal variation, this property could be improved and allow this scanning technique to be used for processes with tighter tolerances than screen printing. Many photographic processes need light levels to be under 0.5% across a plate.
Masks may also help high-performing lenses form a strip at lower cost. The Thor lens spacing, for example, doesn’t reach its average intensity level until the second light center, where the trailing edges of the first and third light both contribute and raise this section well above the first light center. (When analyzed from the center of the first light, the strip has a 16% min-max variation.) This wastes the resources of the first light and lens, except for the very end. A mask could clip or straighten this long, concave tail, making for a more efficient combination.
Because the lens shape was measured in such small increments, a search algorithm could find a mask shape to selectively block parts of the light spot to create a light strip that is even overall.
One challenge with this project will come from small amounts of noise in the existing integration data. This did not prevent successful simulation of spacings, but any masking algorithm will identify these spikes and try to remove them. Cleaner data can come from a better sensor, a fixed measurement set-up, or algorithmic smoothing.
Measurement regression
These experiments generate a lot of data! While this volume was easy work for the pandas library used to analyze it, the visualization was beginning to strain gnuplot. Processing the data into synthetic curve makes some aspects of analysis straightforward (interpolation, solving for minimums, and spacings at a higher resolution than the measured step), and can also smooth out experimental noise.
Try a smaller LED
There are UV LED chips capable of generating just as much light, but from a smaller package. A smaller LED die will have better projection characteristics; ideal collimation occurs with an ideal point-source. These LEDs are not available from retailers pre-mounted on heatsinks (MPCBs), so I’ll have to design and order a small run.
Research polycarbonate lens degradation in UV environments
The Carclo 10108 and 10391 lenses are excellent options, being both the most affordable lenses and having low variation. But! Polycarbonate is known to degrade in UV light. Screen printing emulsion can work with 395, 405, and 415nm-centered LEDs; these lights may be high enough in the UV and low-visible spectrum to be compatible with polycarbonate.
Find a UV sensor with a better response curve for 400-415nm
The UV sensor performed very well in this experiment for its cost ($5 from Adafruit), despite facing a disadvantageous spectral response curve at 400-415nm. But a significantly better sensor may be available, and better match the LEDs being tested. The Osram AS7331, integrated onto a demo board by Sparkfun, has a higher response rate of 20-30% to these wavelengths, has a higher base sensitivity (in nW), comes with a variety of measurement modes, and has a much wider gain adjustment. (The photodiode is at the bottom of a shallow packaging pit though, which may make non-collimated sampling impossible past a threshold angle.)
Automated spacings solver
While feeding spacings into the program by hand is doable, it does add some time for hand-analysis, particularly if the spacing and reasons why it was chosen are forgotten. Doing this solving automatically, generating graphs, and tabulating the results would make this process easier. Interpolation may also allow solving down to .1mm resolution, allowing for more precision.
Appendix of Resources
Some Sensor Scratch Work to Validate the Measurement Set-up
For many parts of the system, the accuracy of the measurement setup is easy to understand. But the sensor itself is hard to reason about; the datasheet has limited information, and there aren’t very many details available elsewhere. With low-cost sensors ($2-3) like these, the intensity values taken by the same sensor usually have some accuracy and repeatability relative to each other. But they aren’t calibrated to anything else, making conversions between intensity values and radiometric output (watts) difficult without additional, expensive equipment. One source states that they are within 10% of a calibrated light meter: https://mouser.com/new/vishay/vishay-veml-sensors/
The sensor datasheet provides two details about accuracy in this experiment. One clue is the resolution, which is listed as “typically” 5uW/cm^2/s. (What does “typically” mean…) Another clue is in the spectral-response graph of the sensor: the 6070 has an ~8% spectral response rate to 415nm light. (A better choice for future experiments would be a sensor whose peak spectral response closely matches the LED being tested; an 8% spectral response cuts the sensor’s resolution by 12.5 for this experiment.)
One detail listed in the LED’s datasheet provides a bridge between these intensity readings and radiometric output. Experiments from this project powered the LED at 500mA — and so did a test done by the LED’s manufacturer. This test lists the output of the 415nm-centered LED between 700 and 850mW, depending on the LED’s brightness bin: https://www.ledsupply.com/content/pdf/leds-semiled-uv_documentation.pdf.
With these three figures, the measurement error is straightforward to calculate. The largest fresnel lens tested has a diameter of 50mm. When 775mW is output over a circle of about 20 square centimeters, the average light level is about 40mW/cm^2. Suppose half the light is lost in the acrylic and the edges of the circle get half of this, making the low-end measurement 10mW/cm^2. Adapted to an 8% spectral response rate, the sensor resolution of 5uW / cm^2 / step is 12.5 worse, at 60uW / cm^2 / step. Out of 10mW/cm^2, this resolution has an error band about 0.6% wide. When more sensitive integration settings are used, this rate is quartered. (The 5uW number is for a 1T integration period; a 4T integration period has a 4x gain.) The error rate can be lowered for an experiment like this: this band applies to a single measurement, showing how far away the physical condition being sampled can be from the intensity value output by the sensor; when an experiment takes many thousands of measurements across a light shape that ranges widely in intensity, the measurements will be evenly distributed across this small error band. The expected error is an average of this even distribution — half the error of a single measurement. All together across the experiment, the error band could be under 0.1%. (There are some remaining issues with measurement error exceeding 0.1% in this experiment; there are some possible sources aside from the sensor’s accuracy, discussed in the hiccups and future work sections.)
The integration of these measurements can also show how calibrated the sensor is to the light’s expected radiometric output (and loosely validate the error rate). While this measurement setup is meant for producing and analyzing distributions, the integration of these measurements can be compared to the light’s expected radiometric output, using the 5uW / cm^2 / step as a conversion rate. At an 8% spectral response rate, an LED output of 775mW should produce an integrated reading of 62mW. (The low and high output ranges of 700 and 850mW set a range of 56mW to 68mW.)
The remaining details are:
- the average reading for the no-lens experiment is an intensity of 166.75, over an 18x18 cm square
- the measurement routine uses an integration multiplier of 4T, for increased sensitivity at lower ranges, making the intensity reading 4 times higher
- the adafruit board uses a 270k resistor for integration, rather than the 240k resistor specified with the datasheet’s 5uW conversion figure. This increases the sensitivity at lower ranges, making the reading 270/240 times higher. (I think this is a gain multiplier; the datasheet does not explain how the rset impacts this reading, other than to explain that it slows readings down.)
All together, this comes to:
Hurrah! In addition to the sensor having an excellent error rate, the sensor and measurement setup is able to closely reproduce the LED’s expected output. Without calibration, it’s not possible to say whether the difference is significant, or where it might come from.
(There is some iffy-ness to this calculation; while the light is centered at 415nm, some light will be present at lower wavelengths, where the sensor has increasing sensitivity. But some light leaves the LED at a 120-degree viewing angle, and escapes the experiment’s measurement square of 180mm. Some lenses that fully surround the LED produced cumulative readings about 10 or 20% higher than the LED without a lens. A better integration of the no-lens would take a reading closer to the LED and prevent light escape.)
